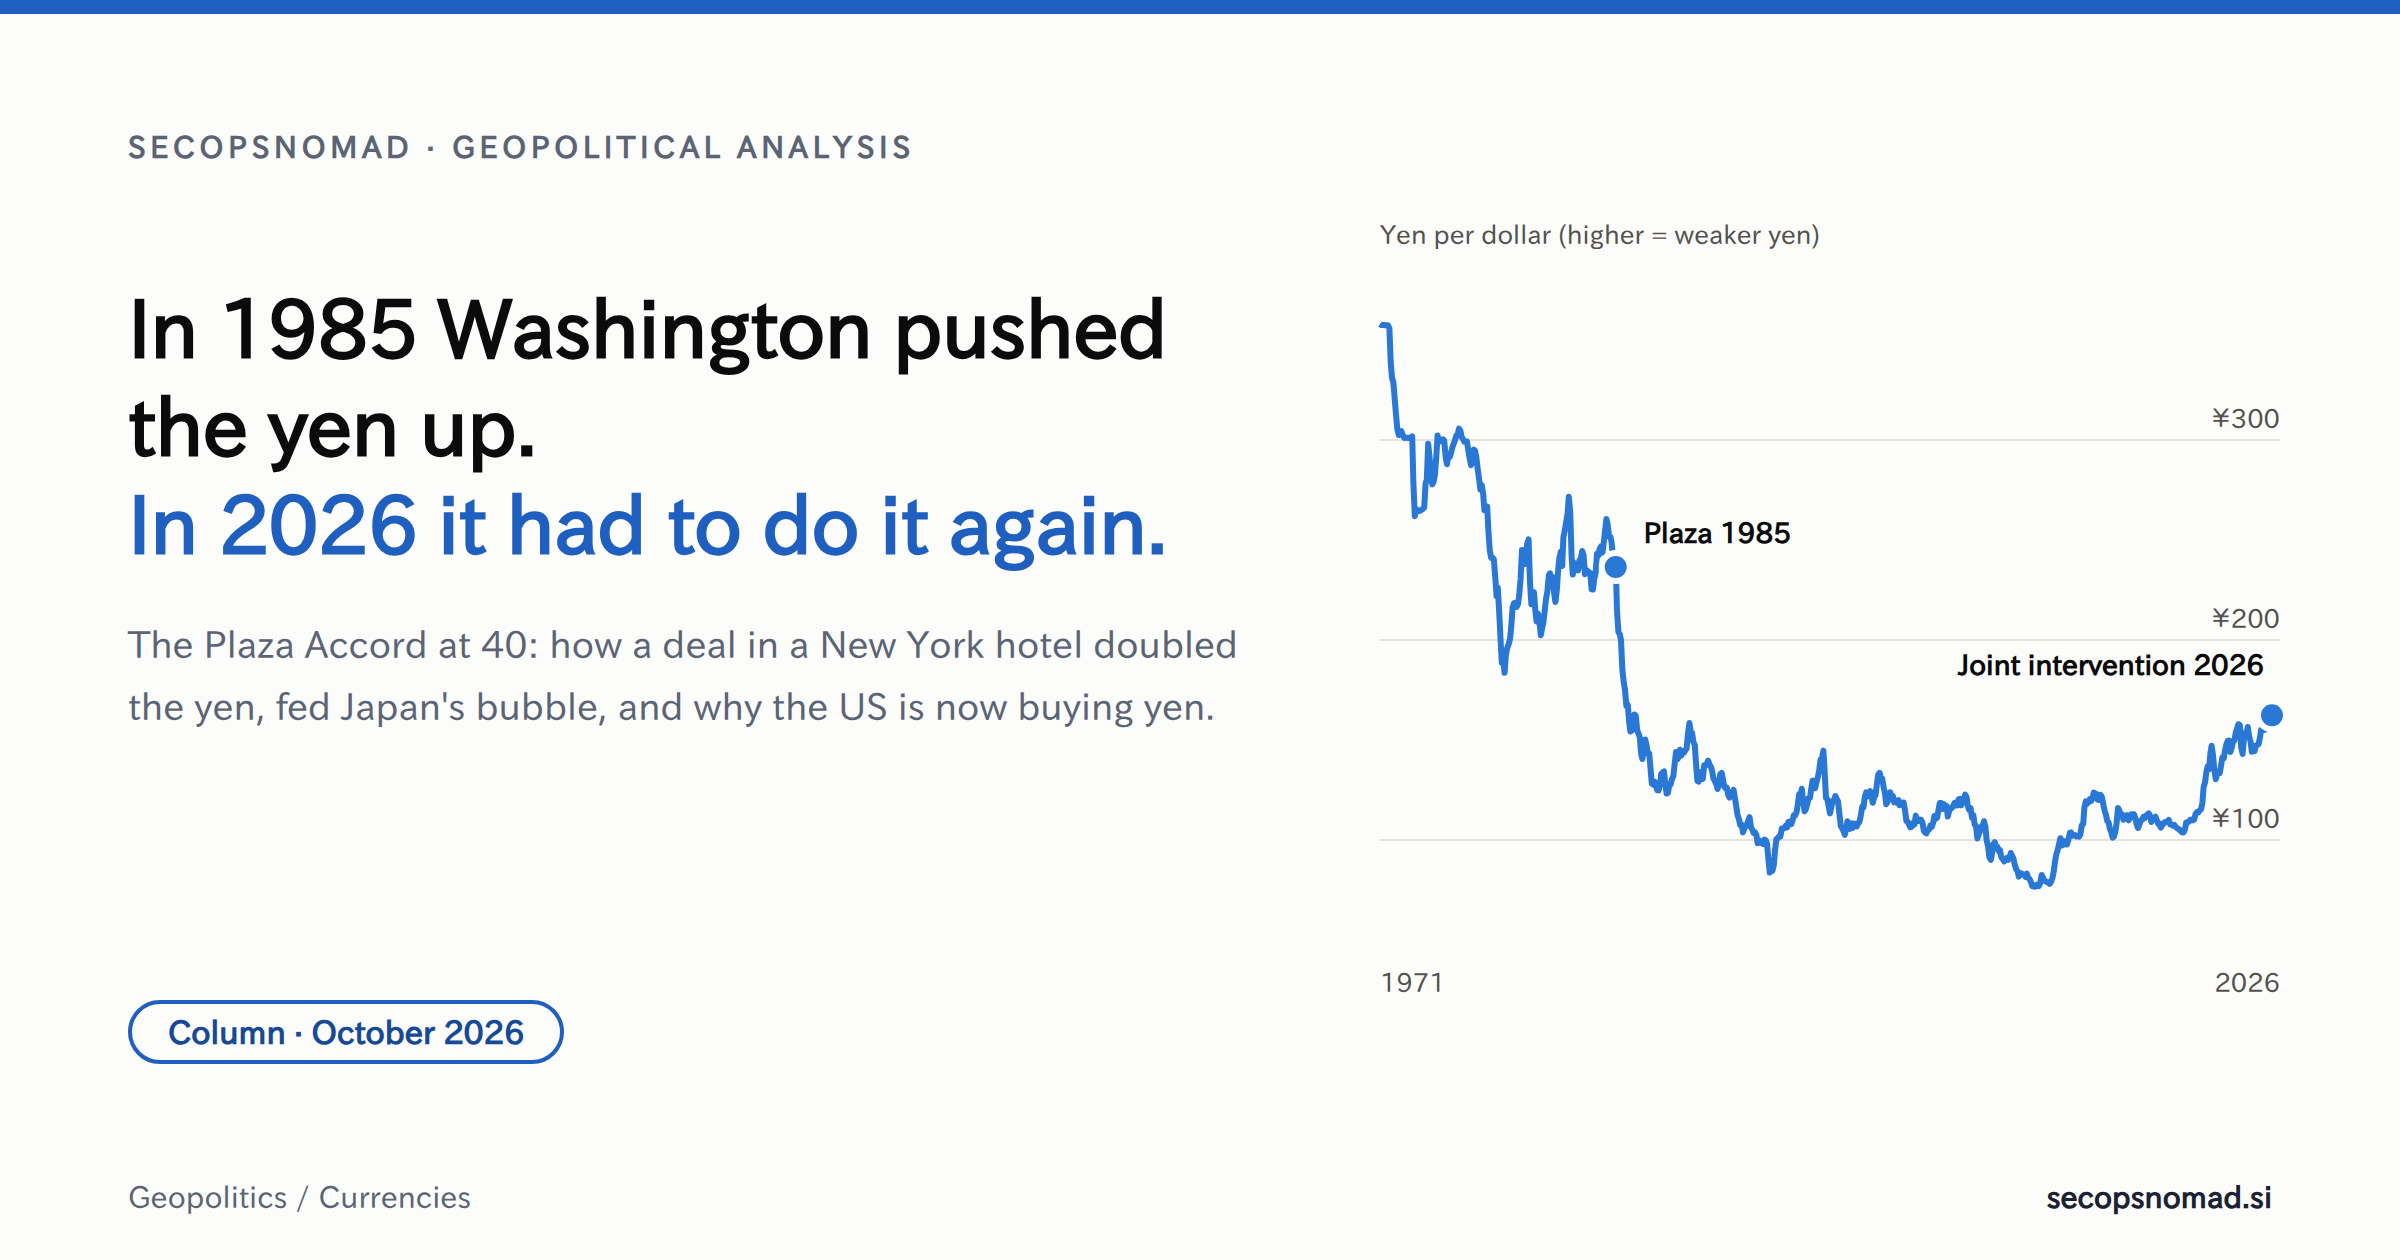
Forty years ago, in a New York hotel, the United States persuaded its allies to push the dollar down and the yen up. This summer the US Treasury bought yen to push it up again. Between the two dates lie Japan's bubble, its lost decades, and a yen that, adjusted for inflation, is now weaker than at any time since 1964. This column explains what the Plaza Accord did, why it still shapes Japan, where the yen stands in October 2026, and what could happen next.
What the Plaza Accord was
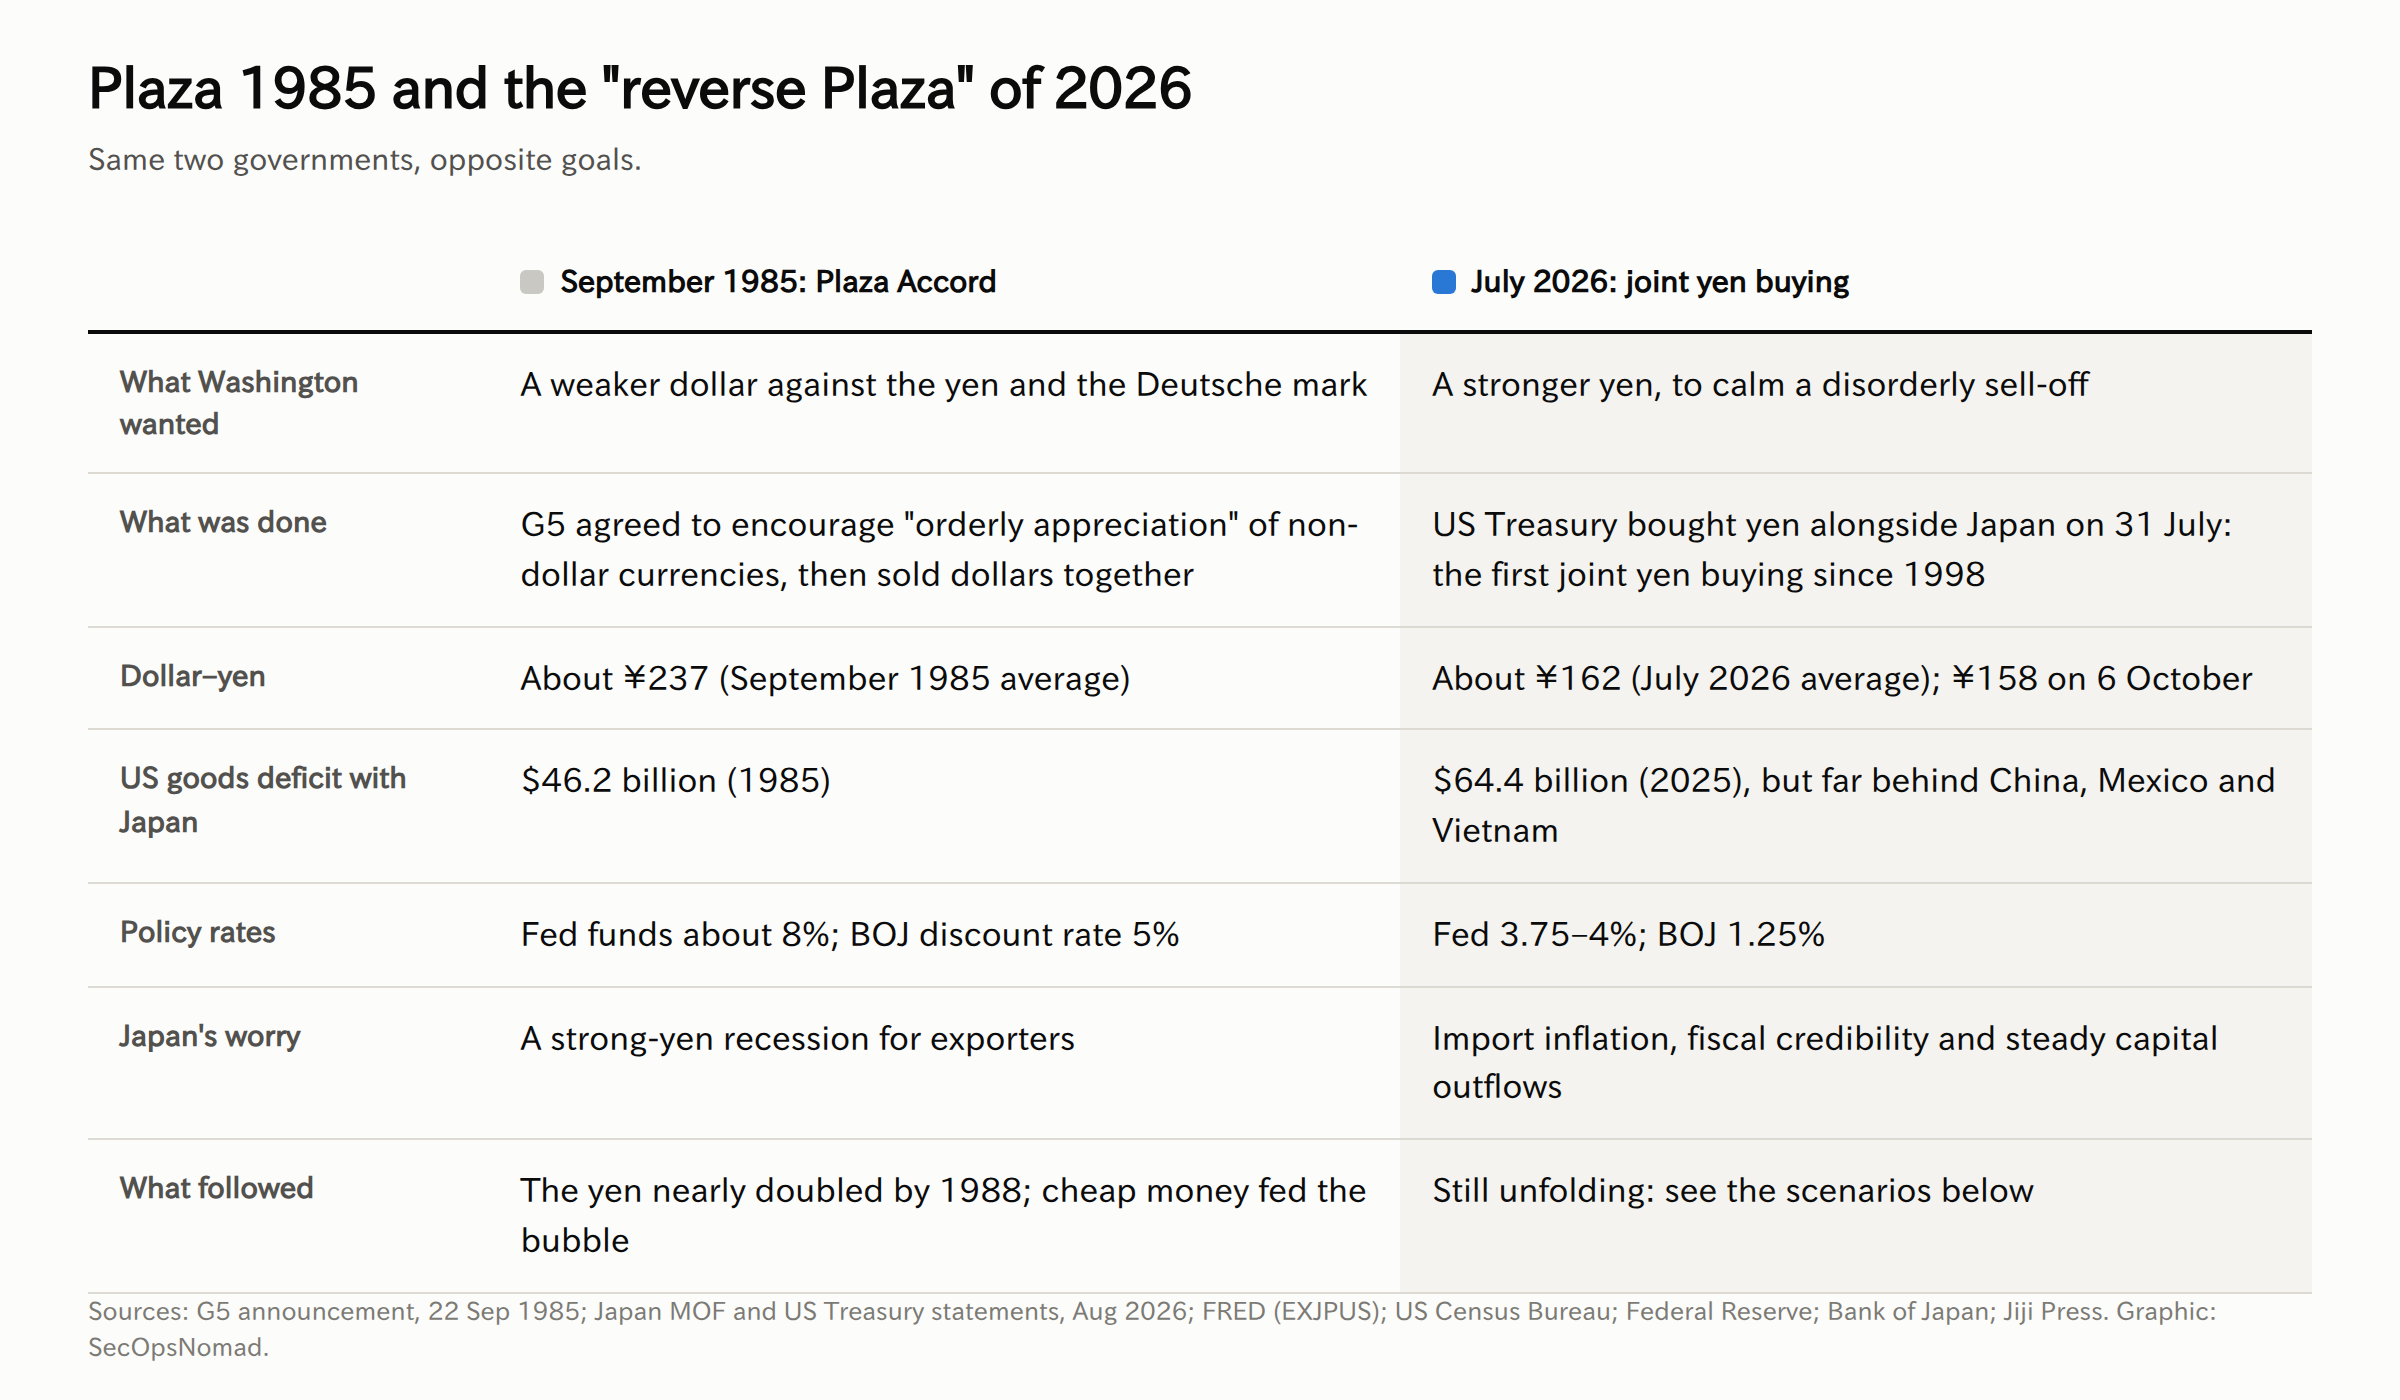
In the early 1980s the dollar soared. High US interest rates under Federal Reserve chair Paul Volcker and large budget deficits pulled money into dollars, and American exporters could not compete. The US goods deficit with Japan reached $46.2 billion in 1985, and Congress was debating protectionist bills aimed largely at Japanese goods. US Census Bureau, trade with Japan
On Sunday 22 September 1985, the finance ministers and central bank governors of the G5 (the United States, Japan, West Germany, France and the United Kingdom) met at the Plaza Hotel. US Treasury Secretary James Baker hosted; Japan was represented by Finance Minister Noboru Takeshita. Their statement was short and deliberately vague: "some further orderly appreciation of the main non-dollar currencies against the dollar is desirable", and the five "stand ready to cooperate more closely to encourage this when to do so would be helpful". In practice, that meant selling dollars together. G5 announcement, 22 September 1985
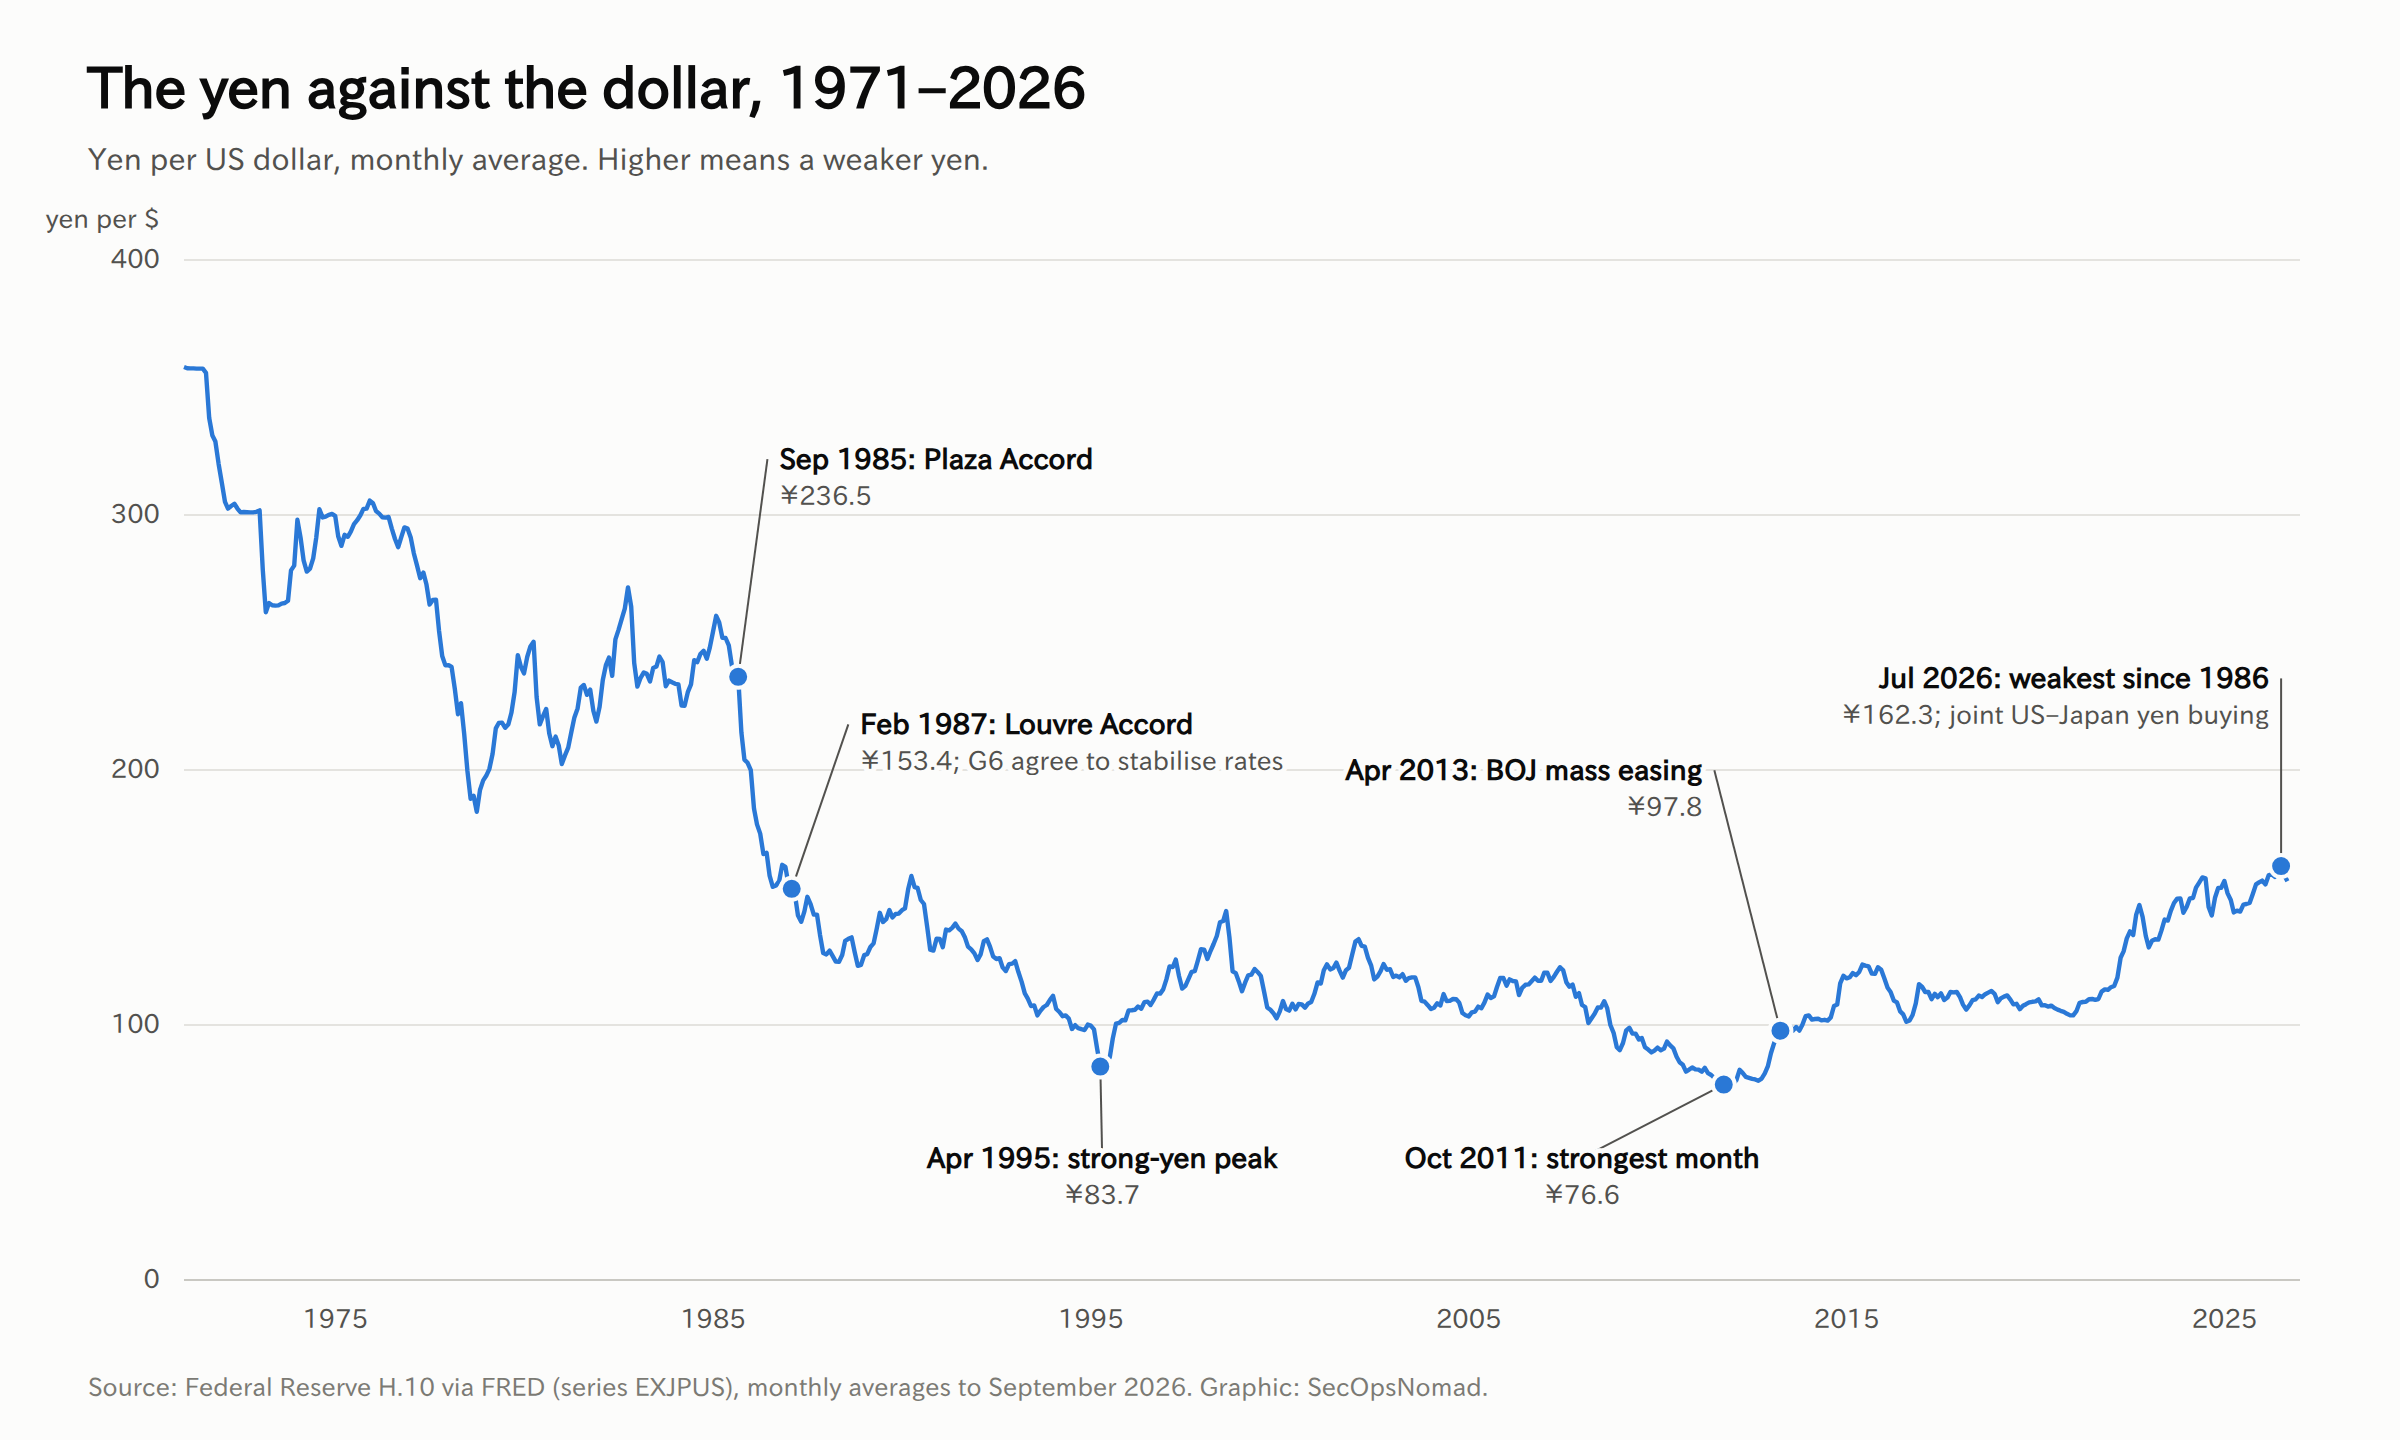
It worked faster than anyone expected. The dollar averaged ¥236.5 in September 1985, ¥202.8 by December and ¥128.2 by December 1987. In just over two years the dollar lost 46% of its value against the yen; put the other way round, the yen gained about 84%. By February 1987 the same governments, meeting at the Louvre in Paris, were trying to stop the dollar falling further. Federal Reserve data via FRED; Takatoshi Ito, The Plaza Agreement and Japan, Baker Institute 2015
How a currency deal became a bubble
The Plaza Accord did not create Japan's bubble on its own. But it set off a chain of decisions that did.
- The strong-yen recession. The fast rise of the yen hit exporters hard in 1986. Japanese call this endaka fukyō, the strong-yen recession.
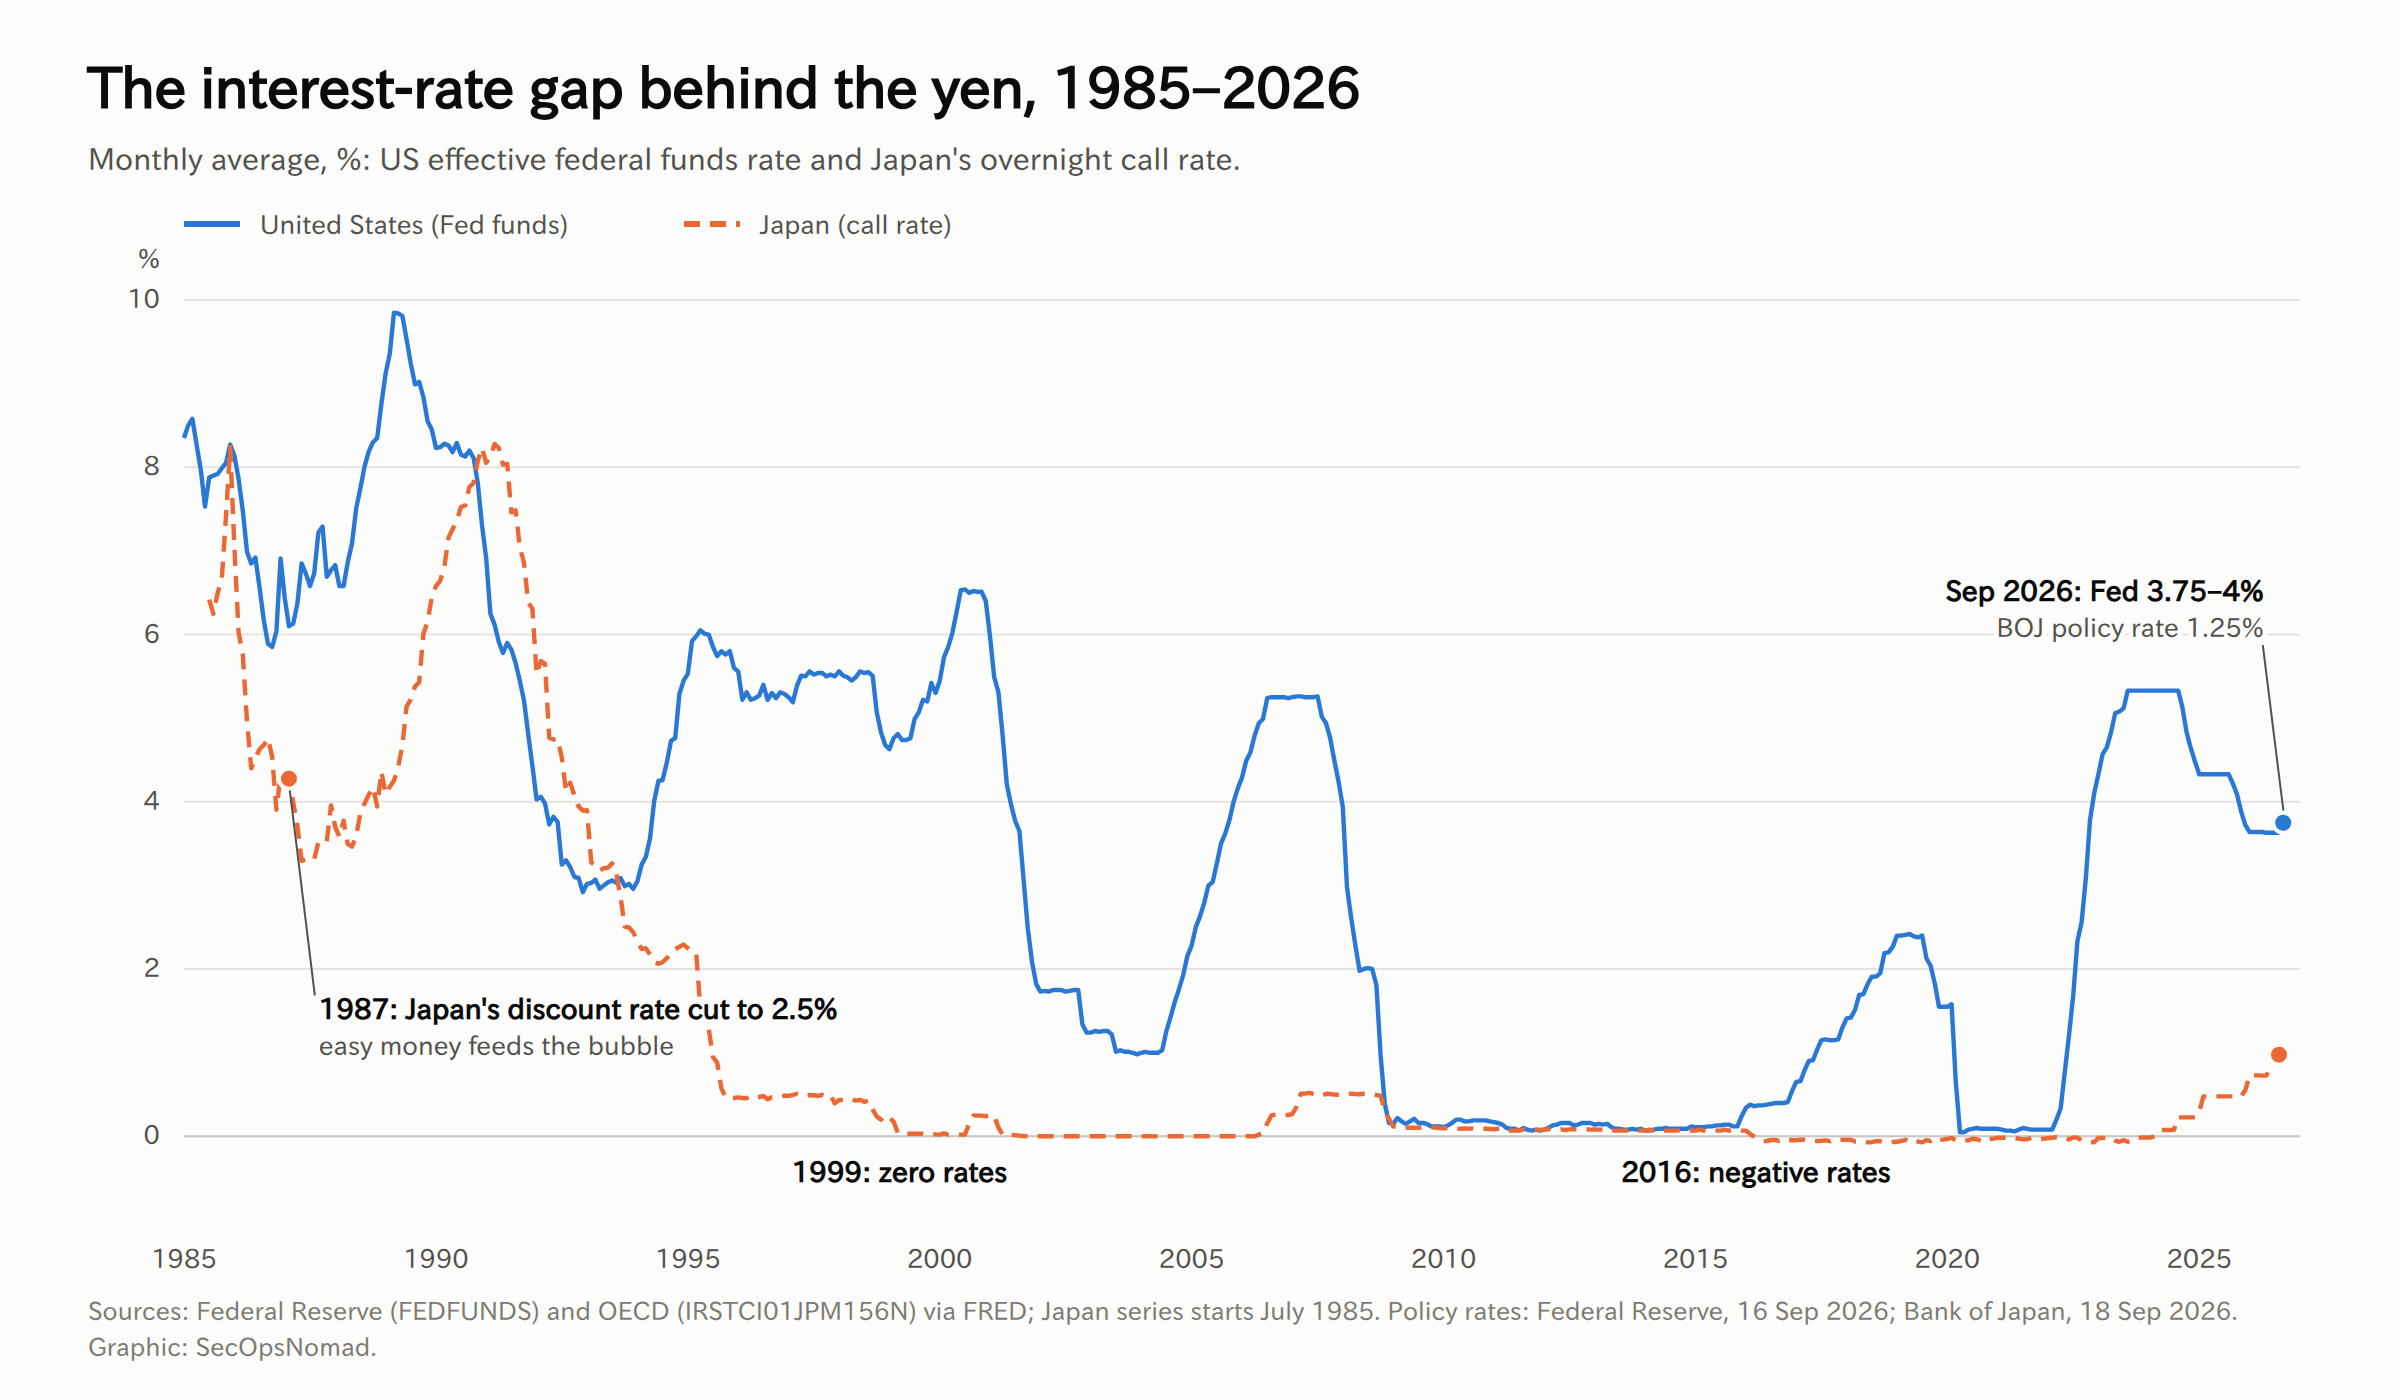
- Cheap money for too long. To support the economy and slow the yen's rise, the Bank of Japan cut its discount rate five times between January 1986 and February 1987, to 2.5%, then a record low, and kept it there until May 1989. Fiscal stimulus followed. Bank of Japan IMES paper on bubble-era policy (Japanese)
- The bubble. Cheap credit flowed into shares and land. The Nikkei 225 peaked at 38,915.87 on the last trading day of 1989.
- The crash and the lost decades. The BOJ raised rates sharply from 1989. Share and land prices collapsed in the early 1990s, banks were left with bad loans, and Japan entered years of weak growth and falling prices.
There is a second, quieter legacy. To survive a strong yen, Japanese manufacturers moved production abroad: car plants in the United States, electronics supply chains across Asia. That is why a weak yen today helps Japan's exporters less than it used to, while still raising the cost of everything Japan imports.
Economists still argue about how much blame Plaza deserves. Many Japanese officials remember it as the start of the bubble; most researchers, including Takatoshi Ito, put more weight on the domestic choice to keep money cheap for too long after the yen had stabilised. Both views agree on one point: a currency deal agreed abroad changed Japan's domestic policy for a decade.
From super-strong yen to super-weak yen
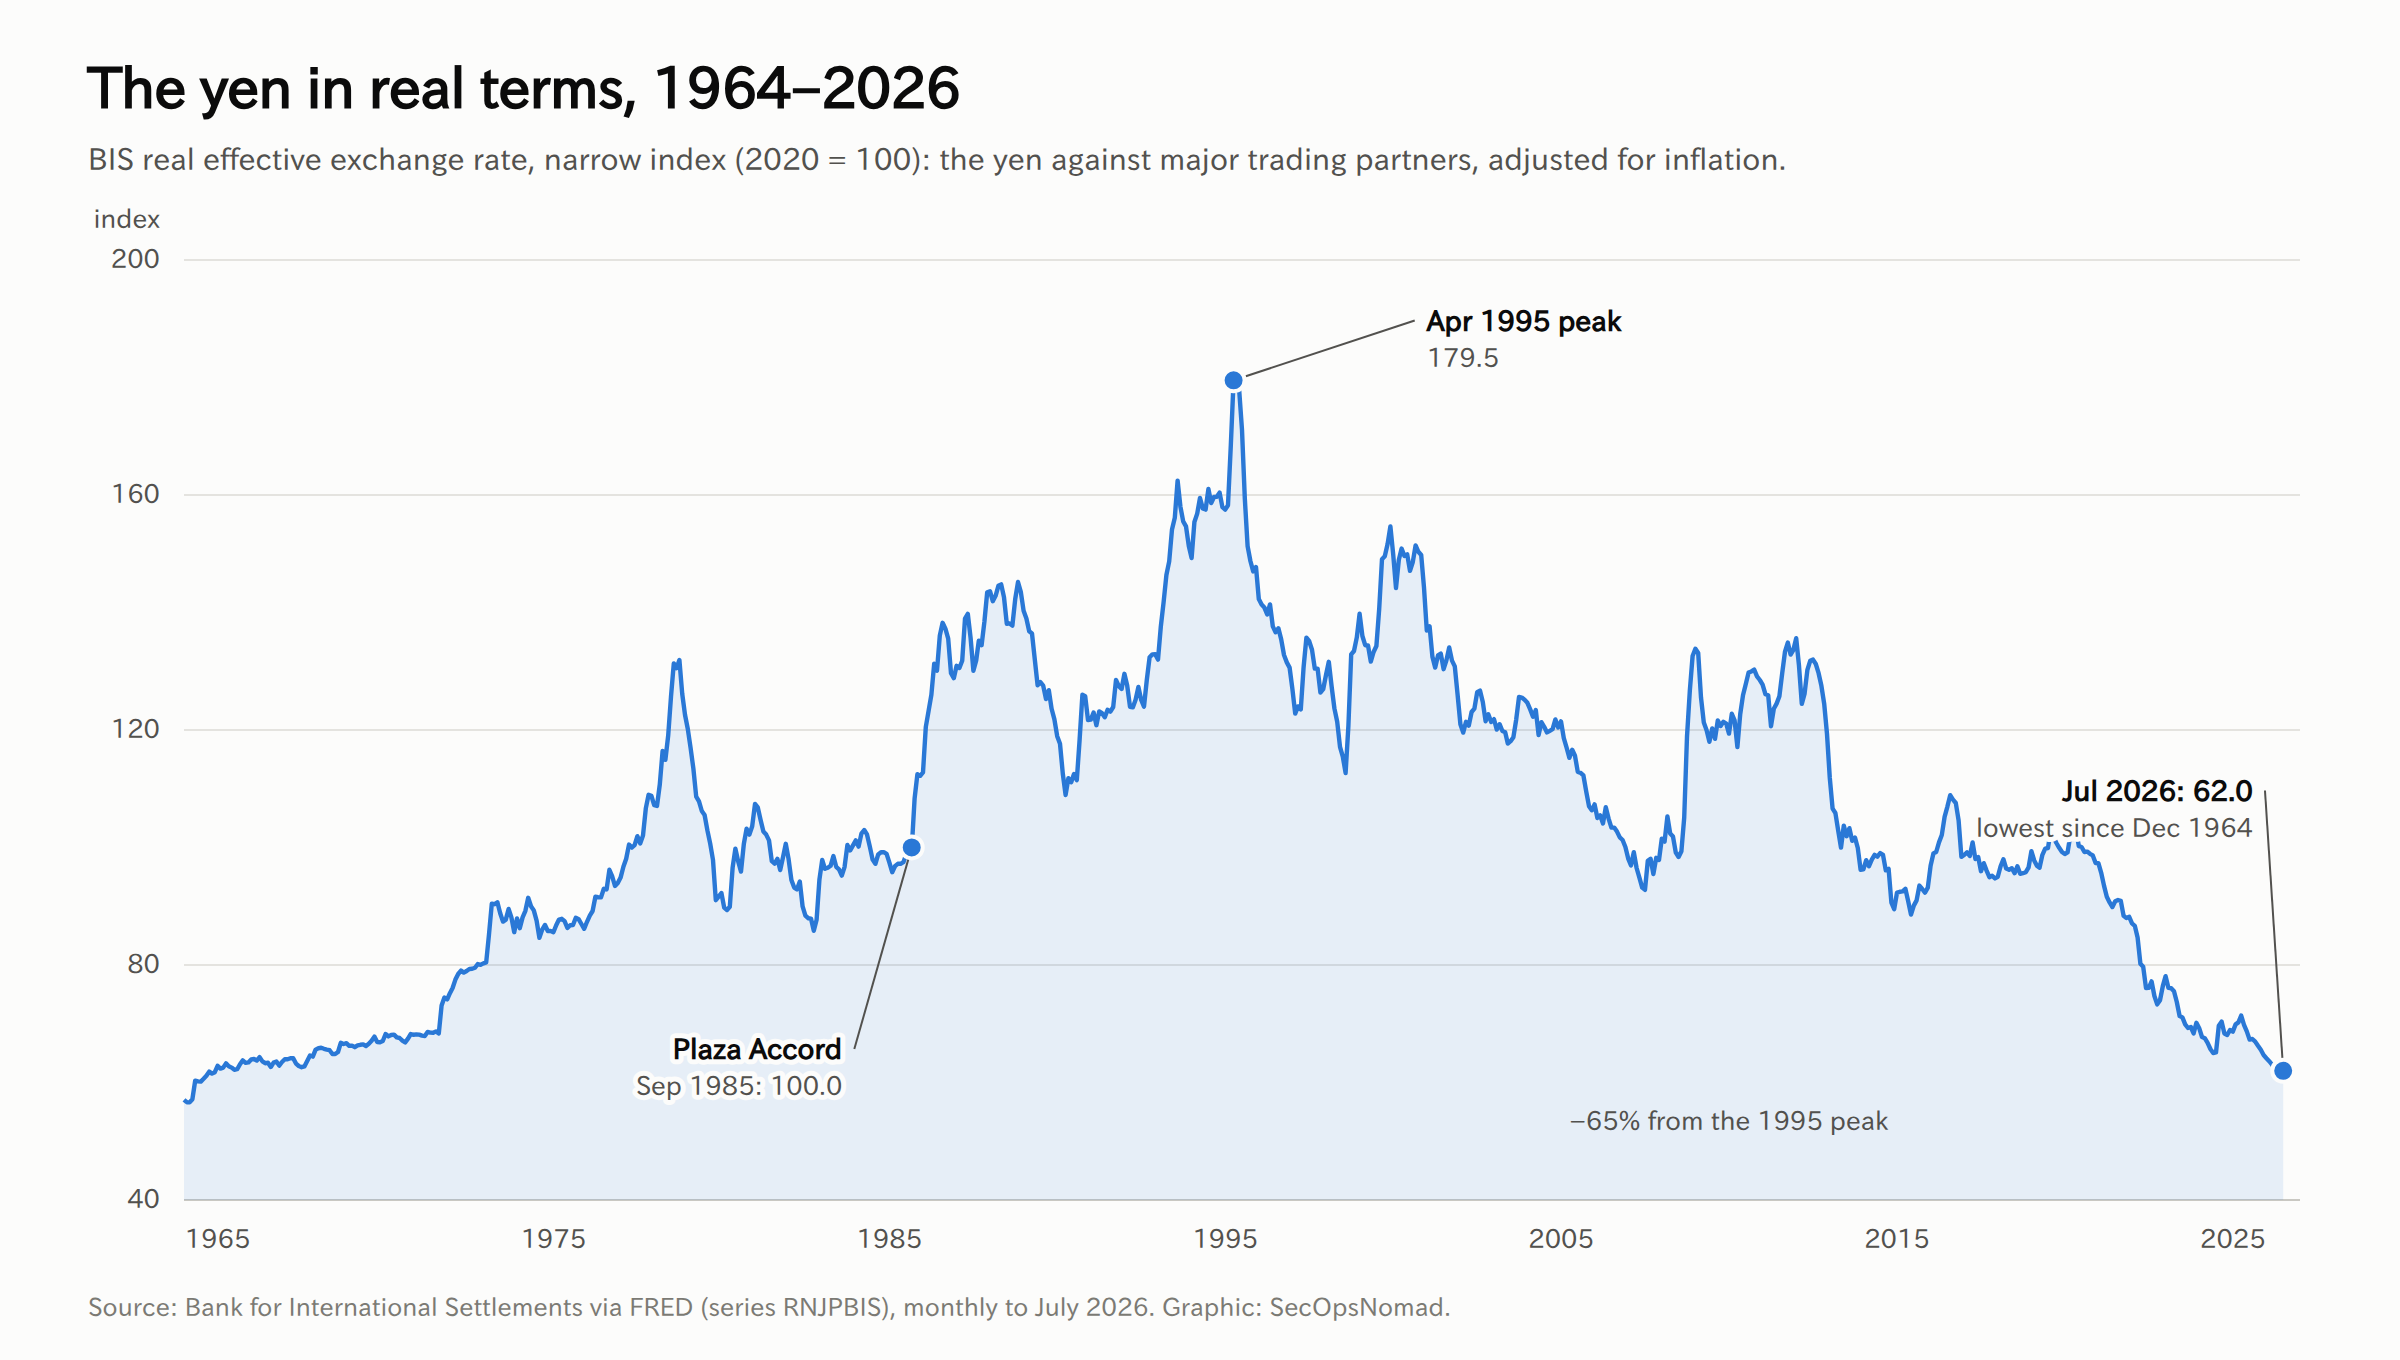
After Plaza, the yen kept rising for a decade. In April 1995 the dollar averaged just ¥83.7, and in real terms the yen reached its strongest level since the BIS index begins in 1964.
The next 30 years reversed that:
- 1998: during the Asian financial crisis, the US and Japan jointly bought yen to stop it falling. It was the last time they would do so for 28 years.
- 1999–2001: the BOJ cut rates to zero and began quantitative easing.
- 2011: after the Great East Japan Earthquake, the G7 sold yen together to stop it rising. The dollar averaged ¥76.6 in October 2011, the strongest monthly yen on record.
- 2013: under Prime Minister Shinzo Abe, the BOJ launched mass easing in April. The yen weakened quickly.
- 2016: the BOJ introduced negative interest rates.
- 2022–2024: the Fed raised rates fast to fight inflation while the BOJ kept rates below zero. The interest-rate gap pushed the yen down, and Japan intervened to support it in 2022 and 2024. The BOJ ended negative rates in March 2024.
Measured against all major trading partners and adjusted for inflation, the fall is dramatic. The BIS real effective exchange rate for the yen was 62.0 in July 2026, the lowest since December 1964 and 65% below its 1995 peak. In real terms, Japan has become cheap: for foreign tourists, for foreign buyers of Japanese companies, and for anyone paid in dollars. BIS data via FRED
2026: the "reverse Plaza"
This year the weak yen became a crisis.
- Rates. The BOJ raised its policy rate to 0.75% in December 2025, 1.0% in June 2026 and 1.25% on 18 September, but the Fed raised too: to 3.75–4% on 16 September, its first increase since 2023. The gap between US and Japanese policy rates is still about 2.5 to 2.75 percentage points. Dai-ichi Life Research Institute on the September BOJ decision (Japanese); Federal Reserve statement, 16 September 2026
- Fiscal worries. Prime Minister Sanae Takaichi's government promotes "responsible proactive fiscal policy". Markets have pushed long-term yields higher: the October issue of the 10-year Japanese government bond carried a 3.1% coupon, the highest in just over 30 years. Prime Minister's policy speech, 5 October 2026 (Japanese); Jiji Press on the 10-year coupon (Japanese)
- The slide. In late July the dollar neared ¥164, the weakest yen in about 39 years and 8 months. The July monthly average, ¥162.3, was the weakest since 1986.
- Record intervention. Japan spent ¥11.7 trillion around the Golden Week holidays at the turn of April and May, including a record of about ¥6 trillion on 30 April, and another ¥15.4 trillion between 30 July and 26 August. That is more than ¥27 trillion this year, far above 2024's record of about ¥15 trillion. Jiji Press on Ministry of Finance data (Japanese)
Then came the moment that makes 2026 the mirror image of 1985. On 31 July the US Treasury bought yen alongside Japan, selling euros from US reserves to do it. It was the first joint US–Japan yen buying since 1998. Treasury Secretary Scott Bessent said the action countered disorderly moves and spoke of a "substantial undervaluation" of the yen; Finance Minister Satsuki Katayama said Japan would not hesitate to act together again. Bessent later described the US amount as nominal and said a stronger yen helps US exporters and means Japan does not need to sell US assets to fund its interventions. CNBC; Reuters; Investing.com via Yahoo Finance
It did not last. The day after the first round, the dollar was back above ¥160 at times. It averaged ¥158.8 in August and ¥156.4 in September, after the BOJ's hike, and stood at ¥158.1 on 6 October. Bessent himself said intervention can only curb volatility; the forces behind the weak yen need Japanese policy changes. Jiji Press, 6 October rate (Japanese)
Why this is geopolitics, not just markets
In 1985, Japan was a rival. It was the second-largest economy, the source of the biggest bilateral US trade deficit, and a target of US trade pressure on cars and semiconductors. Japan accepted a stronger yen partly because it depended on the US for its security and wanted to head off tariffs.
In 2026, Japan is a frontline ally. The US goods deficit with Japan was $64.4 billion in 2025: bigger in dollars than in 1985, but no longer the one Washington worries about most, with China, Mexico and Vietnam all running larger surpluses with the US. Washington's concern is no longer that Japan is too strong. It is that a collapsing yen could destabilise Asian currencies and markets, push up Japanese inflation, and force Tokyo to sell US Treasuries to defend its currency. A weak yen also hurts the US in trade: it makes Japanese goods cheaper in the US at a time when Washington is using tariffs to protect its industry. The 2025 US–Japan tariff deal came with a separate finance ministers' statement, in September 2025, committing both sides to market-determined exchange rates with intervention reserved for excess volatility. Both governments presented the July intervention as a response to disorderly moves, the condition that statement sets. Reuters on the September 2025 joint statement
The new pressures come from inside Japan as much as outside. Mizuho Bank's chief market economist Daisuke Karakama lists the forces keeping the yen weak even when the dollar falls: Japan's very low real interest rates, a growing deficit on digital services paid to foreign platforms, a smaller tourism surplus as relations with China worsened, fiscal concerns, and Japan's heavy dependence on the United States. Jiji Press feature (Japanese)
Washington is also thinking about a new accord. In November 2024, before joining the administration, economist Stephen Miran described how a "Mar-a-Lago accord" might persuade US partners to strengthen their currencies against the dollar. No such multilateral deal exists, but the July 2026 intervention showed that the US is now willing to act directly in currency markets. Stephen Miran, A User's Guide to Restructuring the Global Trading System, November 2024; PIIE commentary
The lesson of 1985 applies in reverse. Intervention can change the direction of a currency when it matches what central banks are doing. In 1985 the US was ready to let its interest rates fall. In 2026 the Fed is raising rates, which pulls the other way.
Where the yen is going
Nobody can forecast exchange rates reliably, and this column does not try. Instead, here are three scenarios to 2028, with the conditions each one needs.
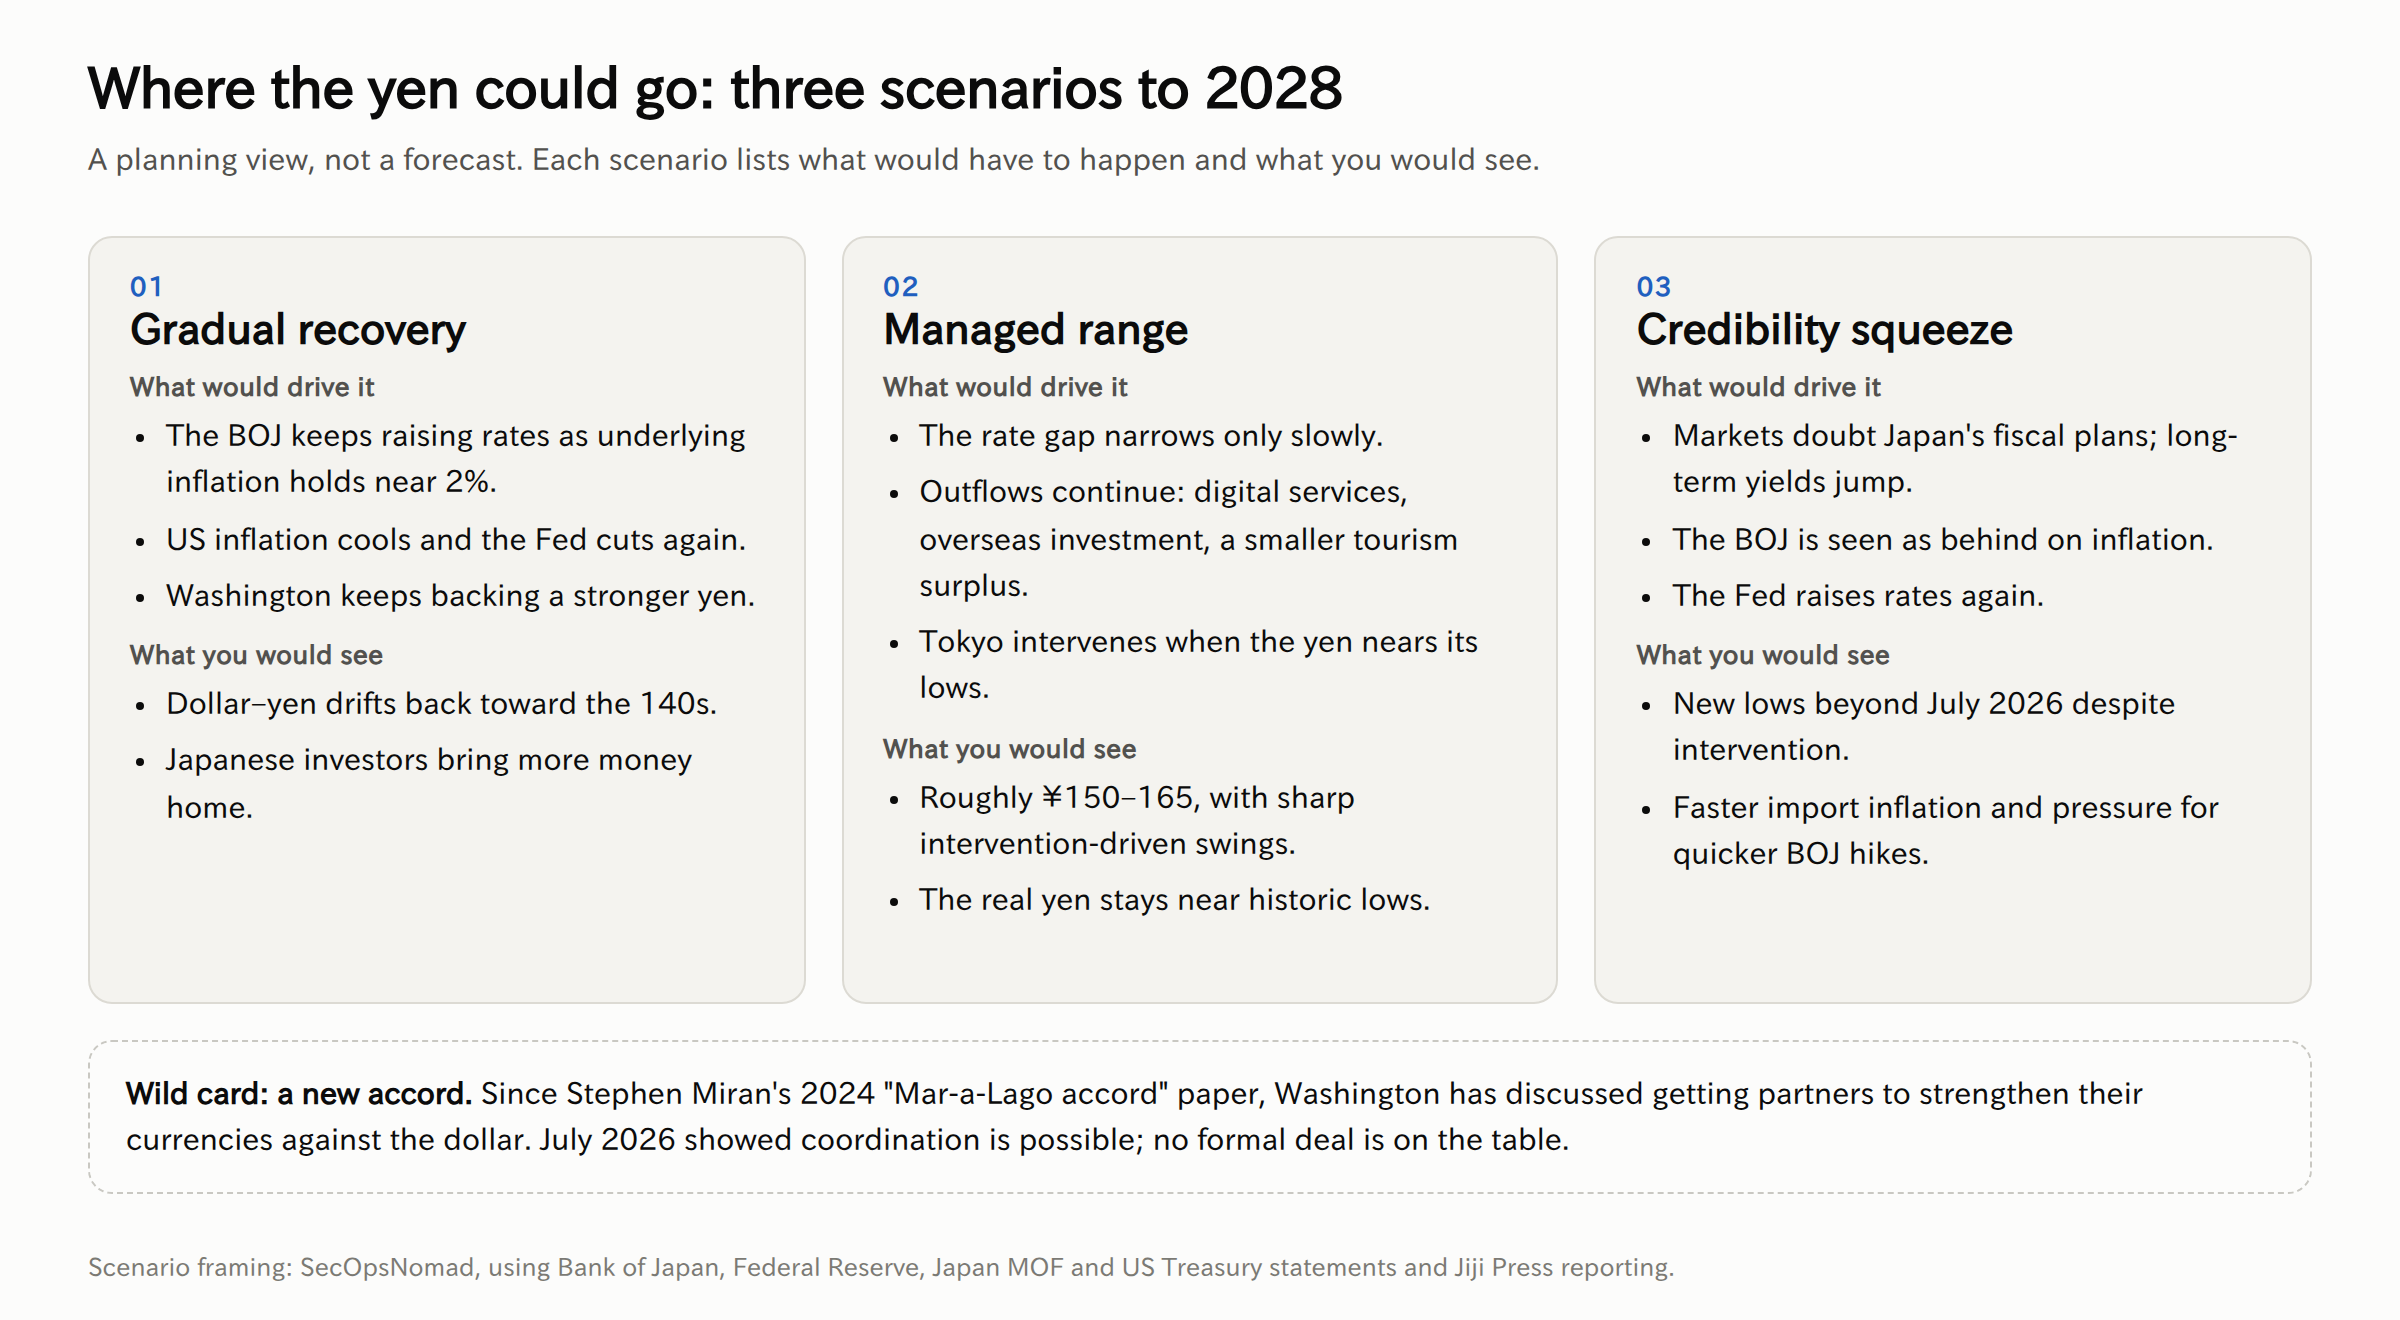
- Gradual recovery. Most likely if underlying inflation in Japan holds near the BOJ's 2% target and the BOJ keeps raising rates, while US inflation cools enough for the Fed to cut again. Jiji Press reports the BOJ is considering judging, as early as its October meeting, that underlying inflation has reached 2%. Jiji Press (Japanese)
- Managed range. Most likely if nothing changes quickly: the rate gap narrows slowly, money keeps flowing out, and Tokyo, now with US backing, intervenes whenever the yen nears its lows.
- Credibility squeeze. Possible if markets lose confidence in Japan's fiscal plans or the Fed keeps raising rates. Intervention would slow a fall but could not stop it.
Signposts to watch
| Signpost | Where to find it | Why it matters |
|---|---|---|
| BOJ decisions and its view of underlying inflation | Bank of Japan meetings | Faster hikes narrow the rate gap |
| Fed decisions after the September hike | FOMC statements | Further US hikes widen the gap again |
| 10-year JGB yield and fiscal plans | Ministry of Finance auctions, budget | Rising yields with fiscal doubts weaken the yen |
| Intervention data | Ministry of Finance monthly figures; daily detail due in November | Shows how hard Tokyo is defending the yen |
| US Treasury statements | Treasury readouts, currency report | Signals whether Washington will act again |
| The real yen | BIS real effective exchange rate | Shows whether the yen is still historically cheap |
| Digital and travel balances | Japan's balance of payments | Shows whether structural outflows are easing |
What it means for businesses and risk teams in Japan
- Budget in a range. Cloud, software, AI services and many security tools are priced in dollars. Plan for a range such as ¥145–170 rather than one rate, and agree in advance what happens at the top of it.
- Check contract currency. Know which suppliers can reprice in yen and when. Multi-year dollar contracts signed at ¥110 or ¥130 now cost far more.
- Expect currency-themed fraud. Big currency moves are a gift to fraudsters: fake "intervention" investment tips, impersonated economists on social media, and requests to change a supplier's payment currency or bank account at month end. Verify payment changes through a known phone number, never the email that asked for them.
- Mind the other side. Exporters, inbound tourism and holders of foreign assets gain from a weak yen. A sudden recovery, as after each intervention, can reverse those gains quickly.
What we do not know
- How much the US spent. Washington has not disclosed the size of its yen purchases.
- Daily Japanese amounts. The Ministry of Finance will publish day-by-day figures for the July–August interventions in November.
- Whether the BOJ will go faster, and whether the Fed's September hike was the first of several.
- Fiscal policy. The size and funding of new spending plans will shape bond yields and the yen.
- US policy. Whether Washington keeps backing a stronger yen, and how that fits with its tariff policy.
Sources
- G5: Announcement of the Ministers of Finance and Central Bank Governors (Plaza Accord), 22 September 1985
- Takatoshi Ito, Baker Institute (2015): The Plaza Agreement and Japan: Reflection on the 30th year anniversary
- Bank of Japan Institute for Monetary and Economic Studies: Monetary policy in the bubble era and its lessons (Japanese)
- FRED: Japanese yen to US dollar (EXJPUS), BIS real effective exchange rate for Japan (RNJPBIS), Effective federal funds rate (FEDFUNDS), Japan call money rate (IRSTCI01JPM156N)
- US Census Bureau: Trade in goods with Japan
- Federal Reserve: FOMC statement, 16 September 2026
- Dai-ichi Life Research Institute: BOJ decision, September 2026 (Japanese)
- Jiji Press: Record intervention, July–August 2026 (Japanese); yen rate, 6 October (Japanese); 10-year JGB coupon (Japanese); BOJ and underlying inflation (Japanese); Daisuke Karakama on the weak yen (Japanese)
- Prime Minister's Office: Policy speech, 5 October 2026 (Japanese)
- CNBC: Bessent on the joint yen intervention; Reuters: How the US–Japan pact came together and the September 2025 joint statement; Investing.com via Yahoo Finance: Bessent calls US yen intervention "nominal"
- Peterson Institute for International Economics: In trying to prop up the yen, the US wants to have its cake and eat it too
- Stephen Miran: A User's Guide to Restructuring the Global Trading System, November 2024
Sources checked on 7 October 2026 (JST). Charts were produced by SecOpsNomad from the data cited. Scenarios are planning views, not forecasts or investment advice.