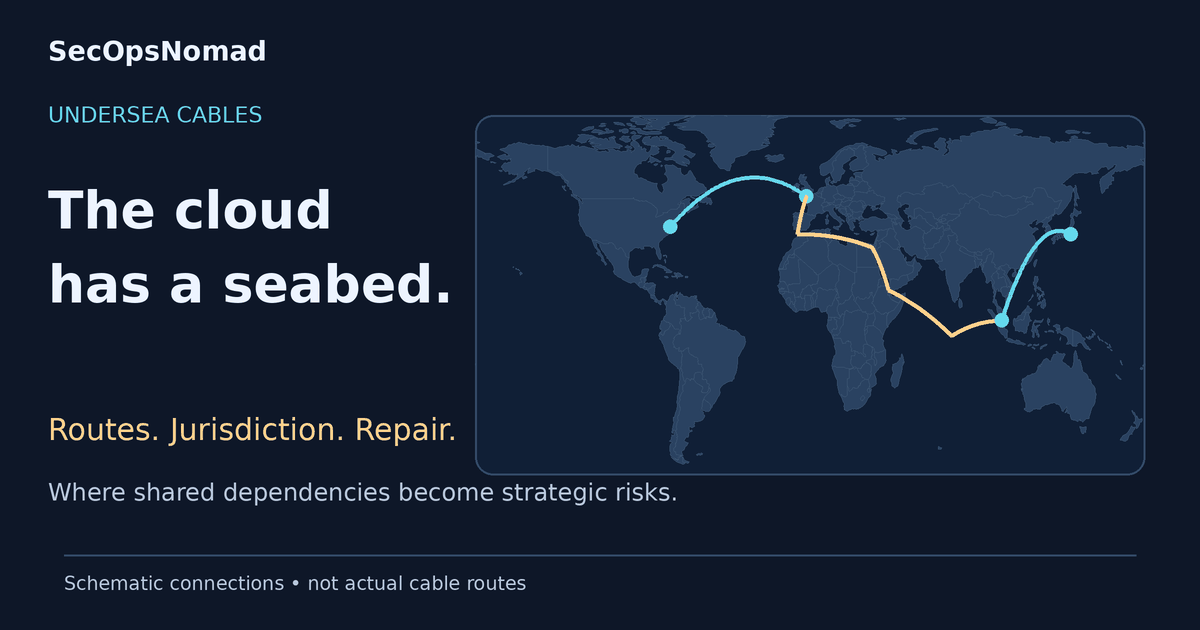
The cloud has a seabed. A payment request, a video meeting or a cloud backup can cross an ocean through infrastructure that still needs a safe landing, electrical power, a maintenance agreement and a ship able to reach a fault. A second contract does not necessarily buy a second way around those dependencies.
The International Telecommunication Union's February 2026 statement puts subsea cables' share at more than 99% of international data traffic. That is an international-traffic measure, not a claim that every domestic internet connection travels under the sea. The strategic question is who can keep these connections working, who can authorise their restoration, and which users have a viable alternative.
This is a visual, source-led column about that question. All maps and network drawings are schematic. They do not identify live cable positions, demonstrate a particular customer's route or allege that a named actor caused an outage. Tap any diagram to open its full-size version.
Geography turns connectivity into bargaining power
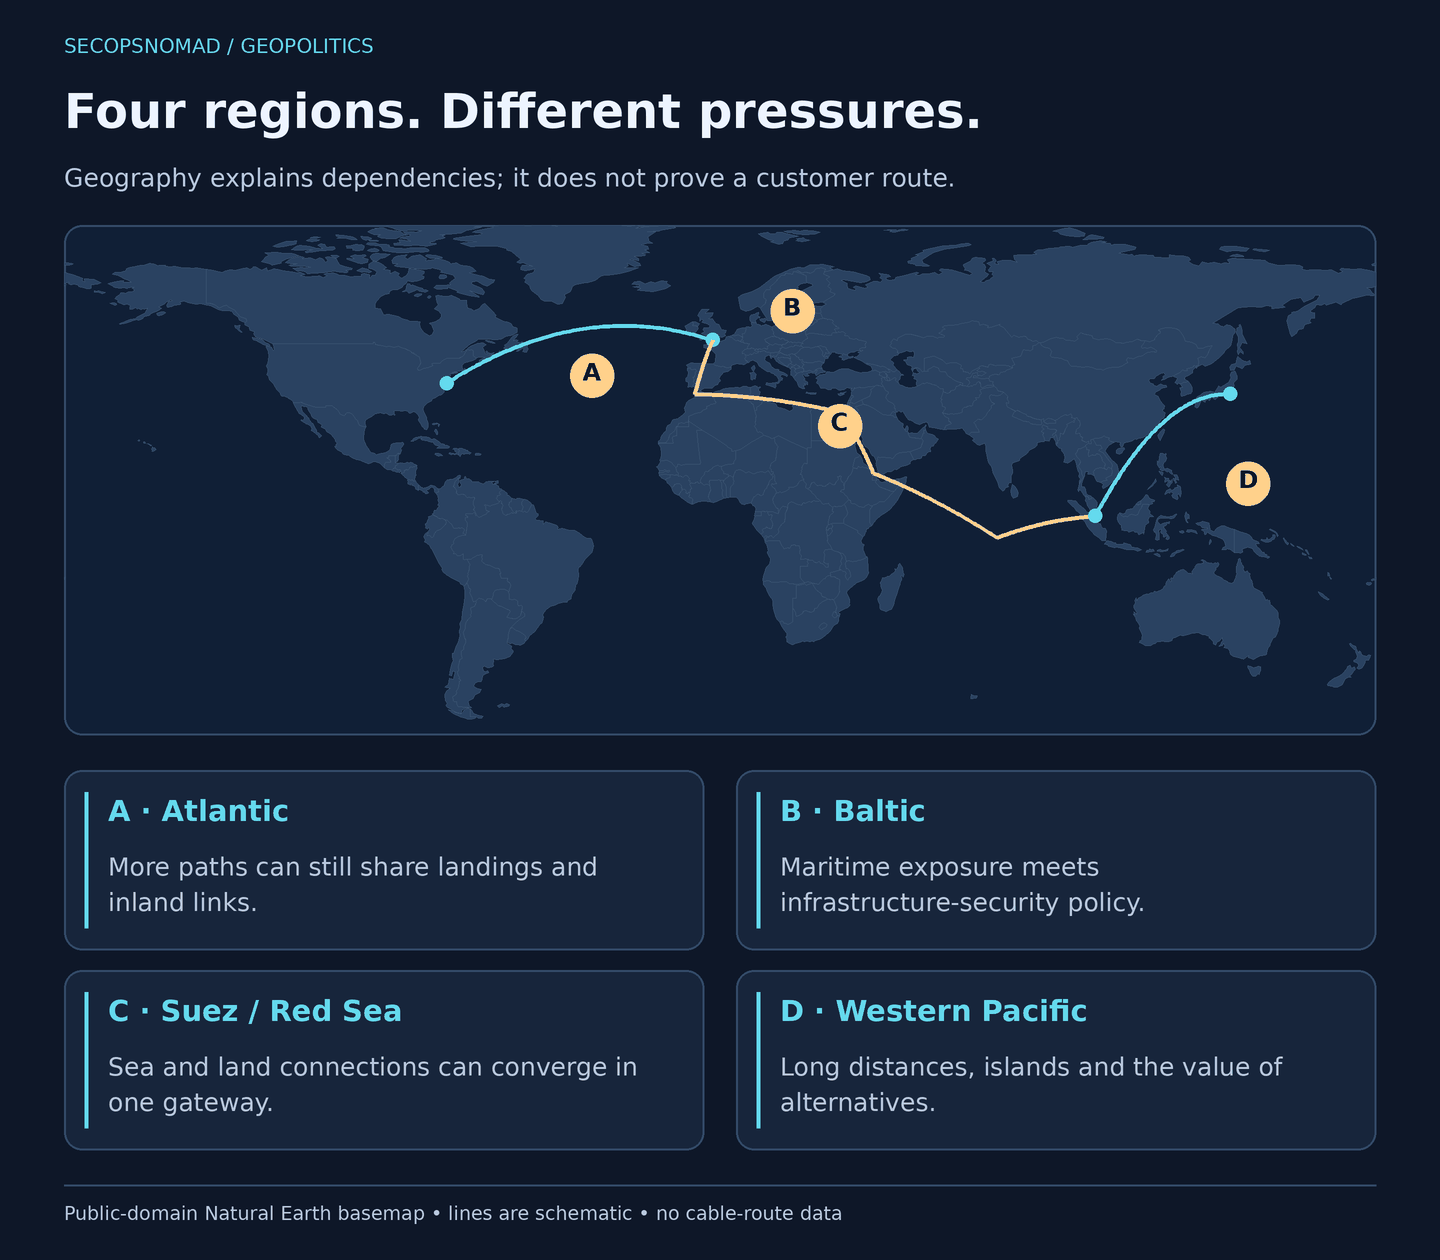
Figure 1. Different seas create different dependencies. Original schematic on a public-domain Natural Earth basemap; no live cable-route data. Open full-size diagram.
Water is not an empty space between data centres. Distance affects the economics of a route; coastlines determine where it can land; inland infrastructure determines whether the landing reaches useful markets. A map with many coloured lines can conceal a much smaller set of shared dependencies.
TeleGeography's 2025 map overview identifies major corridors including the trans-Atlantic, trans-Pacific, intra-Asian and Europe–Asia route via Egypt. Our map uses broad regions to explain the strategic questions, rather than reproduce TeleGeography's cable map.
- Atlantic: more potential paths do not remove the need to check which landing areas and inland routes a particular service uses.
- Baltic: physical maritime risk and the political response to infrastructure incidents have to be assessed together, without treating proximity as proof of intent.
- Suez and Red Sea corridor: a route can cross sea and land. Alternative commercial arrangements may still converge in the same geographical gateway.
- Western Pacific and island economies: a second international connection can matter enormously, but the landing, domestic extension and repair access remain part of the service.
Our assessment: bargaining power sits at the points where alternatives become expensive or slow. The relevant question is not simply how many cables exist globally, but which independent paths can serve a specific place when a regional dependency is unavailable.
A cable is one link in a longer system
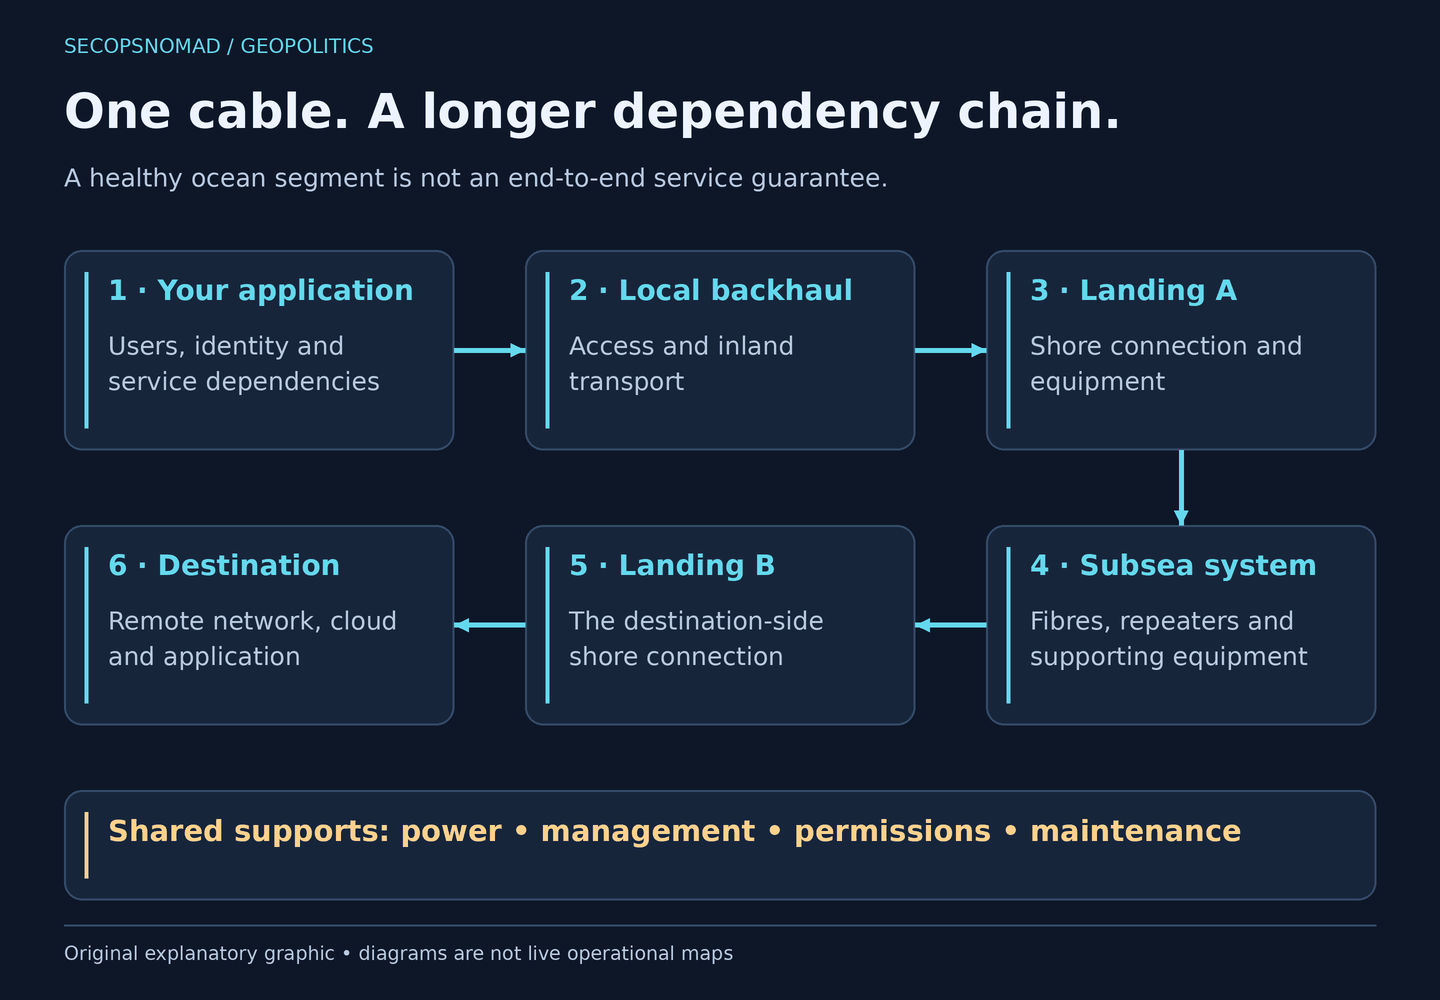
Figure 2. The service depends on more than the wet cable. Original explanatory diagram; boxes do not represent a particular operator's design. Open full-size diagram.
The ocean segment transports light through fibres, with supporting equipment along the system. At either end, a landing connects that segment to terrestrial networks. The application still needs working backhaul, routing, name resolution and the services at its destination.
That changes the unit of analysis. Counting submarine systems is not the same as measuring usable capacity. Design capacity, equipped capacity, purchased capacity and the bandwidth actually available to your service are different things. A line on a public map does not reveal your contract or the spare capacity available during simultaneous failovers.
The same distinction applies to the cloud. Two cloud regions can reduce some application risks while depending on common international transit, identity services or customer access. Two internet providers can sell different products while leasing parts of the same physical system. Neither arrangement is automatically inadequate; the missing step is evidence about shared dependencies.
Encryption helps protect the confidentiality of traffic that does move. It cannot make a severed fibre available. Conversely, an application outage or an unusual route change does not establish physical cable damage. Operations teams need to separate the service symptom, the failed component and the underlying cause.
Fault, mechanism, intent and actor are four different claims
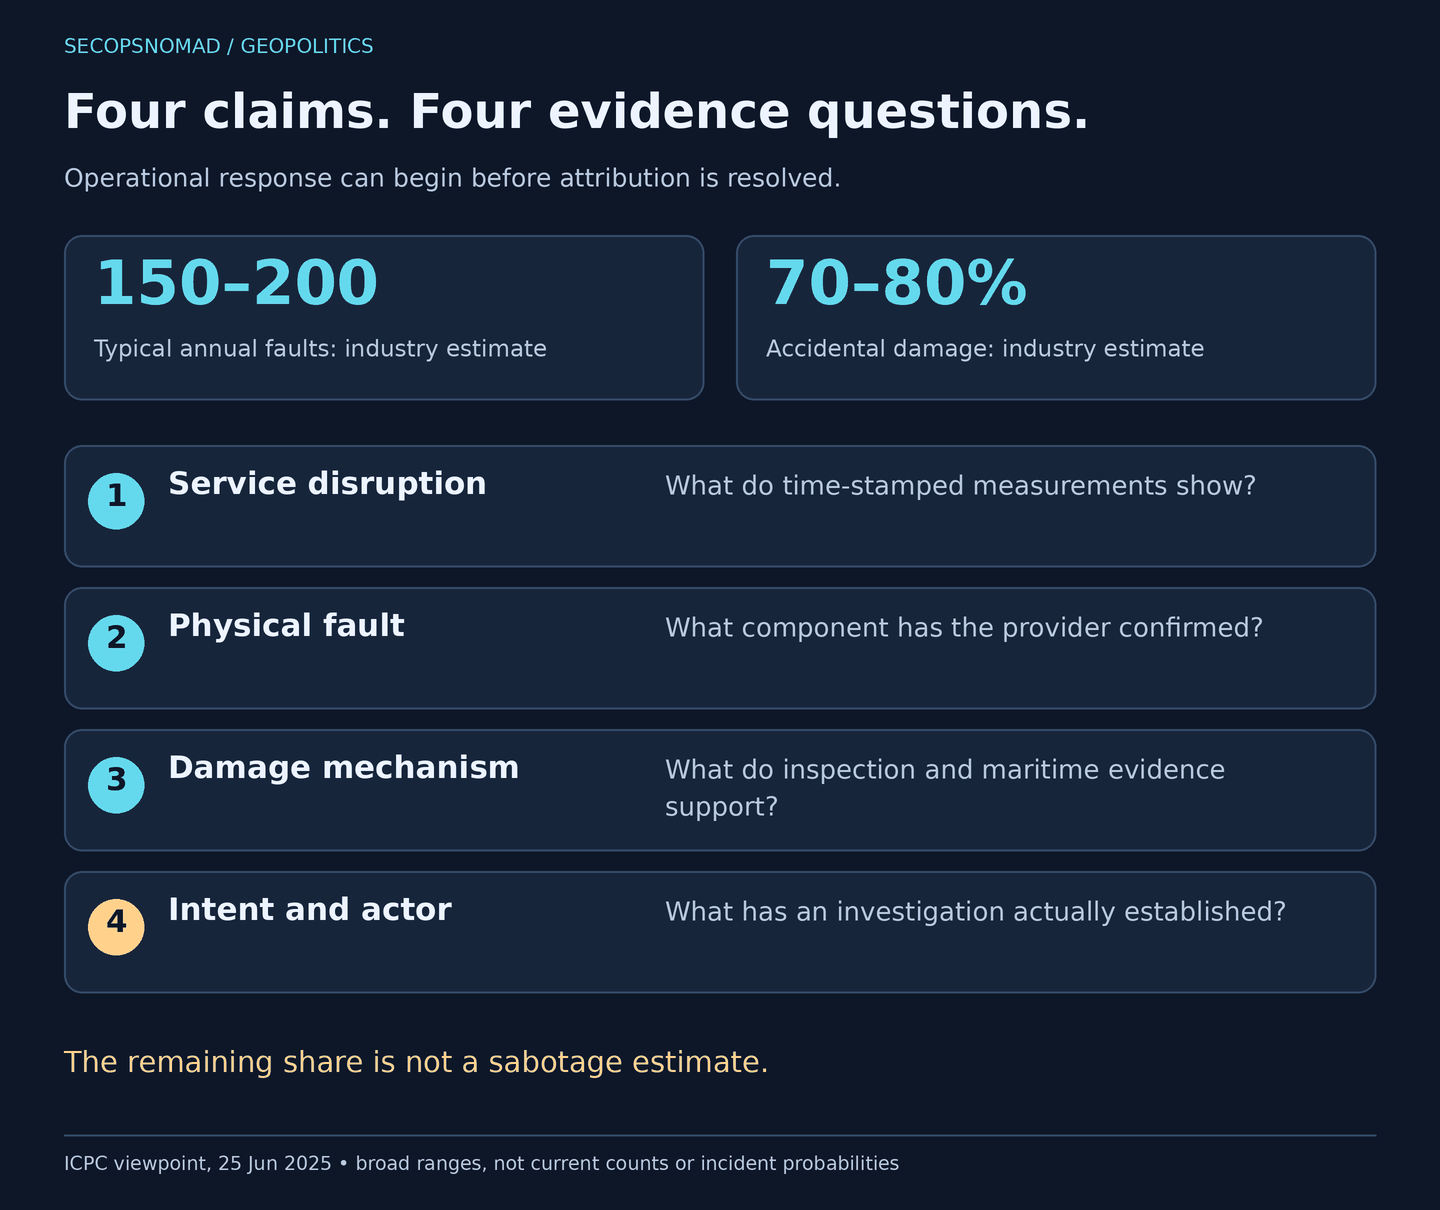
Figure 3. Do not jump from a service alarm to actor attribution. Industry ranges: ICPC's June 2025 viewpoint. The ladder is our analytical framework. Open full-size diagram.
The ICPC viewpoint describes roughly 150–200 annual faults, with 70–80% due to accidental damage, principally fishing and anchoring. These are broad industry estimates, not a current outage count or a probability for an individual incident. Different reporting series and periods should not be combined into a single precise total. The remainder must not be relabelled as sabotage.
A damaged cable can have a large strategic effect without having been deliberately targeted. A deliberate act can also be serious even if traffic reroutes successfully. Impact, mechanism and intent therefore need separate records.
For a particular event, an operator notice can establish a service or system fault. Establishing the mechanism may require physical inspection and maritime evidence. Establishing intent and responsibility needs an investigation; a vessel's nationality, its presence nearby or a tense political context is not enough on its own.
Our assessment: uncertainty can be exploited in several directions. An actor can benefit from disruption; a government can frame ambiguous damage as a security threat; commentators can turn coincidence into certainty. Report confirmed observations and official assessments with their dates and attribution. Restore essential service while leaving unresolved causes unresolved.
Tonga and the Baltic show different kinds of exposure
The World Bank's account of Tonga's January 2022 eruption describes 38 days of internet isolation after the international cable was cut. That experience demonstrates the consequence of a concentrated connection under a natural hazard. It is not an example of sabotage. ITU's March 2022 update also distinguished restoration of the main international cable from the still-unrepaired domestic extension to outer islands.
Emergency connectivity, restoration of the main link and recovery for every community are different milestones. A satellite option may support selected services, but its usable capacity, terminals, power, coverage and permissions need to be assessed for the actual workload. An alternative that supports emergency messaging should not silently be counted as a replacement for all normal traffic.
The Baltic illustrates another dimension. NATO announced Baltic Sentry on 14 January 2025 to strengthen protection of critical infrastructure. A security activity is evidence of a policy response; it does not, by itself, settle the cause or perpetrator of every individual cable incident.
The common thread is consequence management. One case makes geographical dependence unmistakable; the other shows how infrastructure protection becomes part of alliance policy. Both require practical restoration capability as well as a political position.
Who controls the connection? Ask at several layers
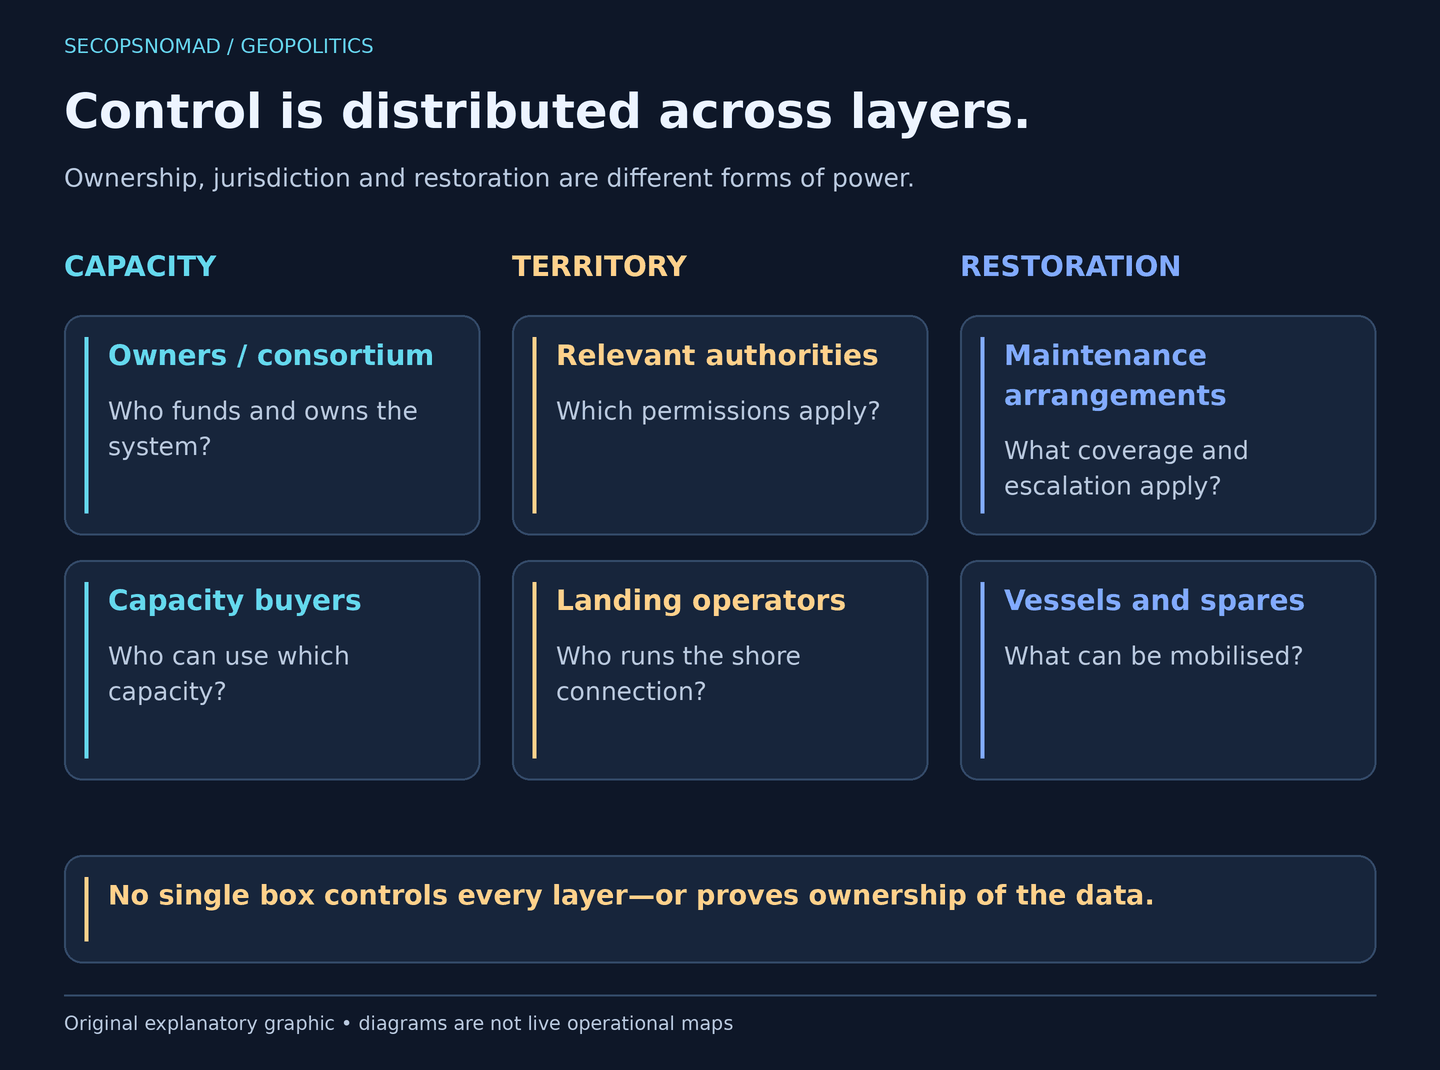
Figure 4. Control is distributed across assets, contracts, jurisdictions and operational capability. Original analytical diagram. Open full-size diagram.
Ownership is important, but it is an incomplete description of power. A consortium can own a system; a customer can buy capacity; a landing operator can run equipment; authorities can control relevant permissions; a maintenance arrangement can determine access to repair resources. Their interests need not be identical.
Our assessment: there are at least three political bargains embedded in a cable project:
- Access and investment. Who finances the system, receives capacity and can afford an alternative? A commercially weak market can be strategically important.
- Territory and trust. Which jurisdictions and suppliers are accepted? A policy that reduces one dependency can narrow the pool of available partners or routes.
- Restoration and cooperation. Who can approve work, release resources and coordinate across borders when normal arrangements are under strain?
Japan's foreign ministry connected digital infrastructure to Pacific partnership in its December 2024 statement on Tuvalu's first cable landing, referring to cooperation on connectivity and resilience. A landing ceremony is a project milestone, not proof of fully independent routes or a guarantee about future availability.
For Japan and other island-connected economies, the strategic interest extends beyond where a cable touches their own coast. The destination landing, intervening jurisdictions, maintenance coverage and inland path also matter. A supplier's national identity cannot answer all of those questions.
The repair clock starts before a ship sails
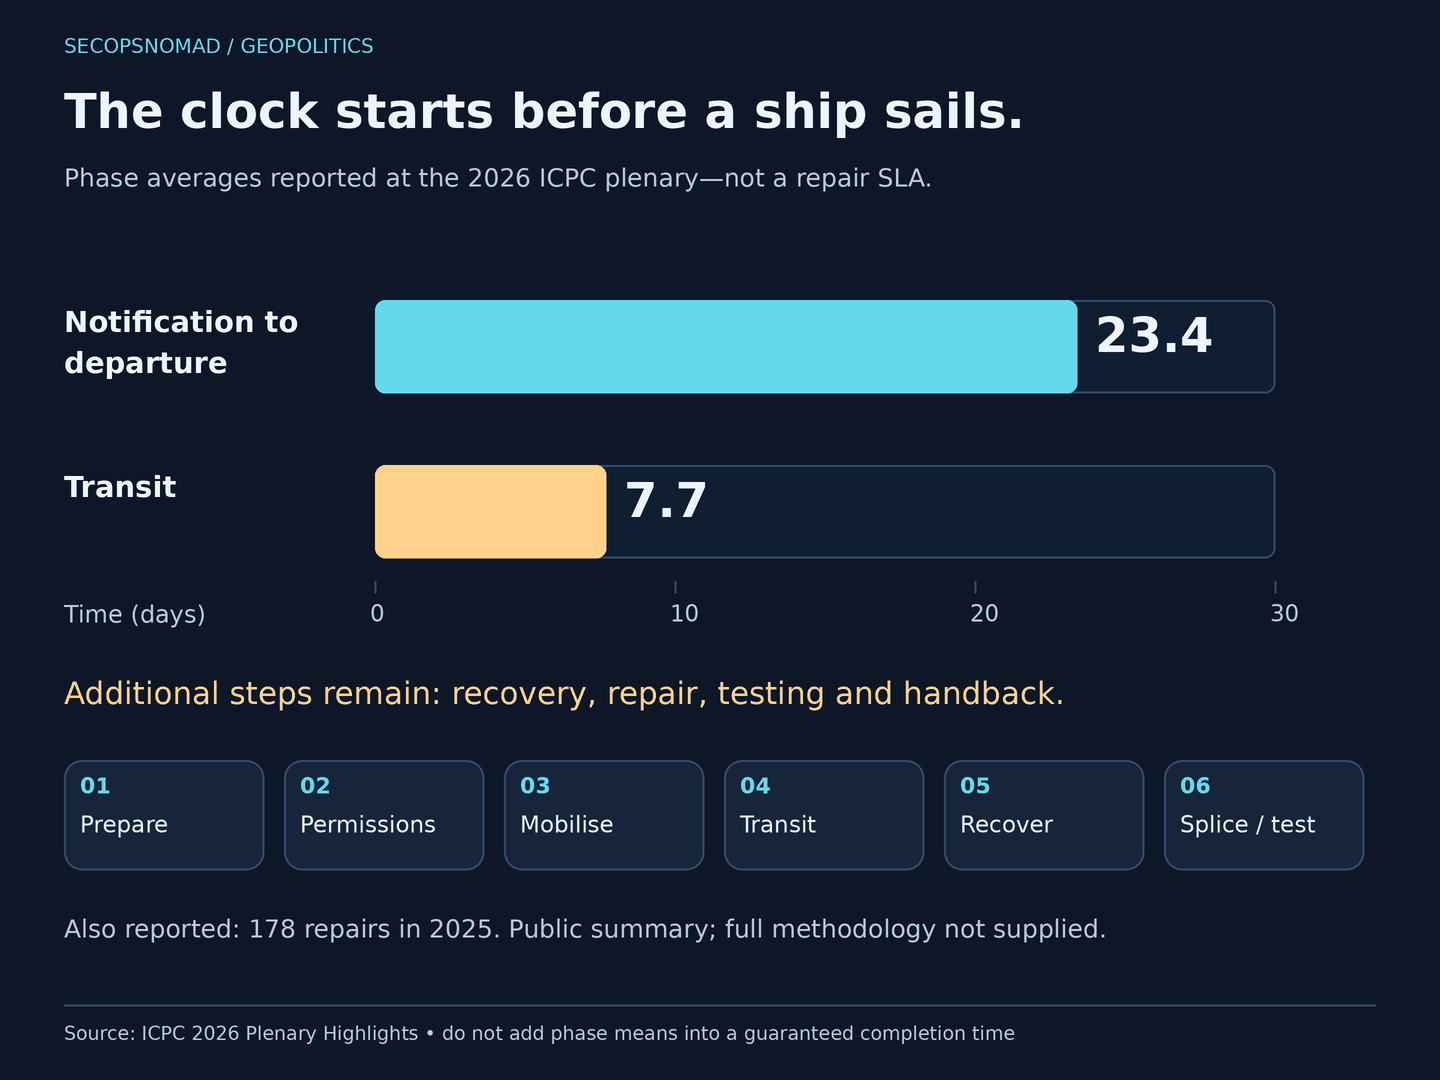
Figure 5. Waiting and transit are part of the restoration problem. Values reported in ICPC's 2026 plenary summary; the process strip is explanatory. The public summary is not a complete statistical methodology. Open full-size diagram.
The ICPC summary reports 178 repairs in 2025 and phase averages of 23.4 days from notification to departure and 7.7 days in transit. It does not provide enough methodology to turn those figures into a universal end-to-end repair estimate. They should not be added to create an SLA; recovery, repair, testing and handback add further work.
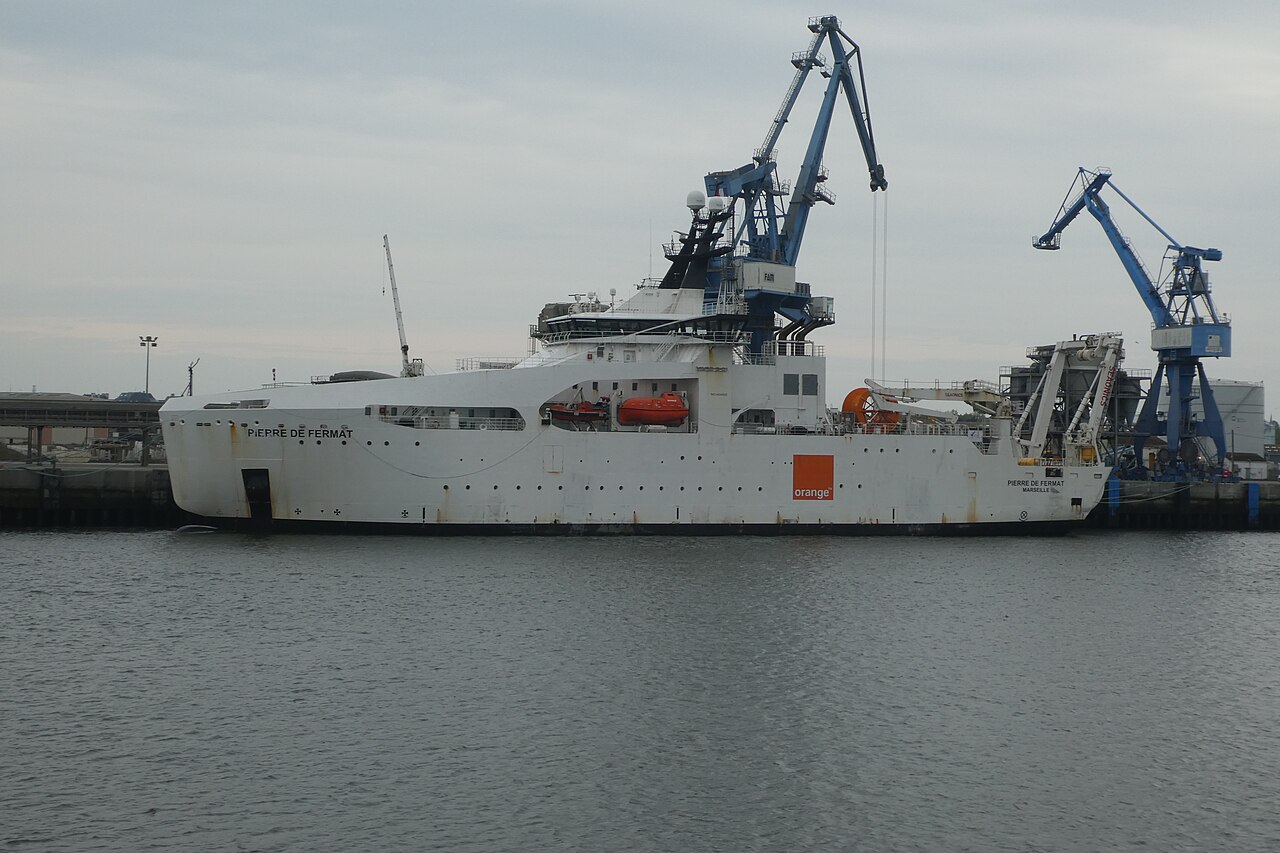
Figure 6. A physical restoration capability, not an abstract cloud failover. Pierre de Fermat, illustrative archive photograph by Pmau, CC BY-SA 4.0, via Wikimedia Commons. Thumbnail supplied by Commons; no crop or content alteration by SecOpsNomad. The ship is not alleged to be involved in an incident described here.

Our assessment: restoration is a chain of available capabilities. A vessel needs suitable equipment, crew and spares; the work needs the applicable permissions; weather and location can constrain access. Several constraints can be active together, so a neat calendar sequence is only an illustration.
Buying resilience means asking about maintenance coverage before the incident. Which arrangement applies? How are concurrent faults handled? What can the provider say about mobilisation, permits and communication when the location is uncertain? A promise to investigate is different from a committed service-restoration objective.
Governments can help reduce administrative friction and improve coordination. Surveillance can help detect or deter some activity. Neither automatically supplies a spare ship, repairs a landing's power supply or creates enough alternate bandwidth for every affected customer.
Two providers can still mean one point of failure
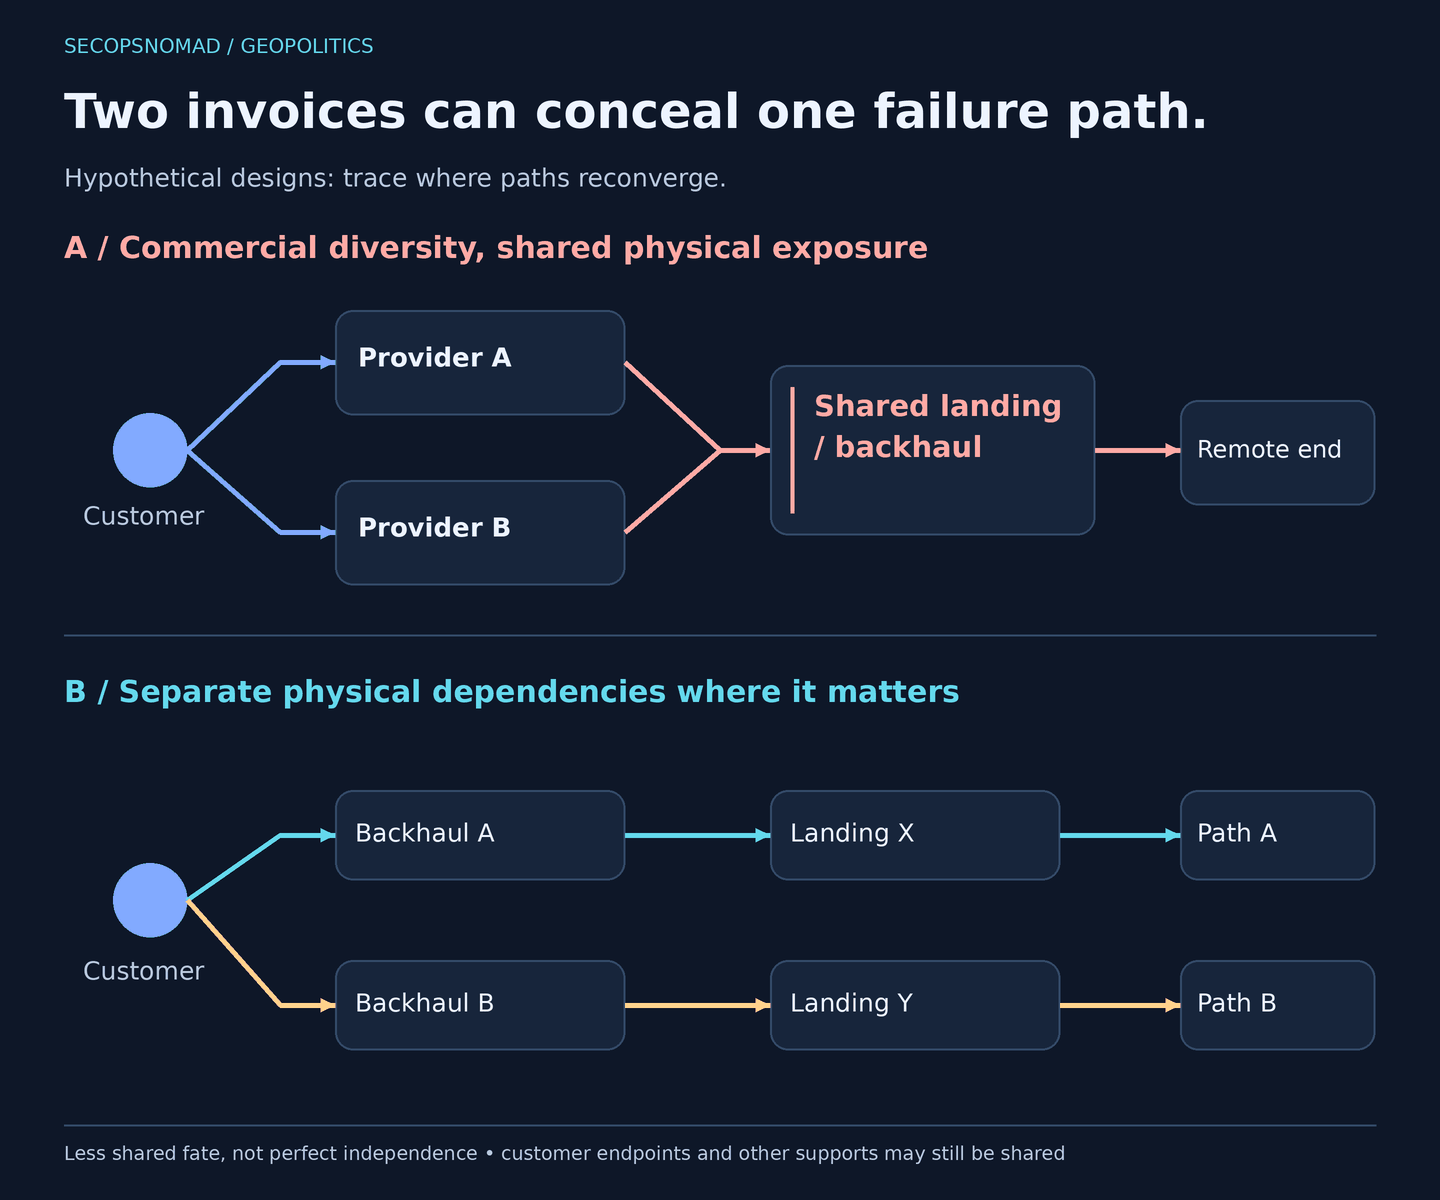
Figure 7. Commercial diversity and physical diversity answer different questions. Original hypothetical designs; no customer or real route is depicted. Open full-size diagram.
A useful diversity review follows the service from end to end. Ask where two paths reconverge, not merely where their suppliers differ.
| Layer to check | Evidence worth requesting | What it still cannot prove |
|---|---|---|
| Local and inland path | Provider-confirmed shared-risk information, distinct access and backhaul arrangements | That every subcontracted segment is independent or that the information remains current. |
| Landing and power | Landing-area separation, station dependencies and power arrangements | That a regional hazard cannot affect both. |
| Ocean corridor | System and corridor diversity appropriate to the threat being planned for | That a longer route has adequate usable capacity or acceptable latency. |
| Destination services | Dependency map for cloud, identity, DNS and essential partners | That an application failover has been exercised under load. |
| Restoration | Maintenance arrangements, escalation contacts and objectives | A guaranteed repair date or priority in an unspecified regional event. |
An ordinary traceroute can help show logical path behaviour, but cannot certify the exact submarine route. Public maps are useful context. Relevant physical diversity evidence usually needs confirmation from the supplier, sometimes under confidentiality arrangements.
Test the alternative with the business service, not only a successful ping. Check usable bandwidth, latency, packet loss, authentication, name resolution and the dependencies of remote staff. Protect critical services first if the alternate path cannot carry the full normal workload.
Four planning scenarios, without pretending to predict the next incident
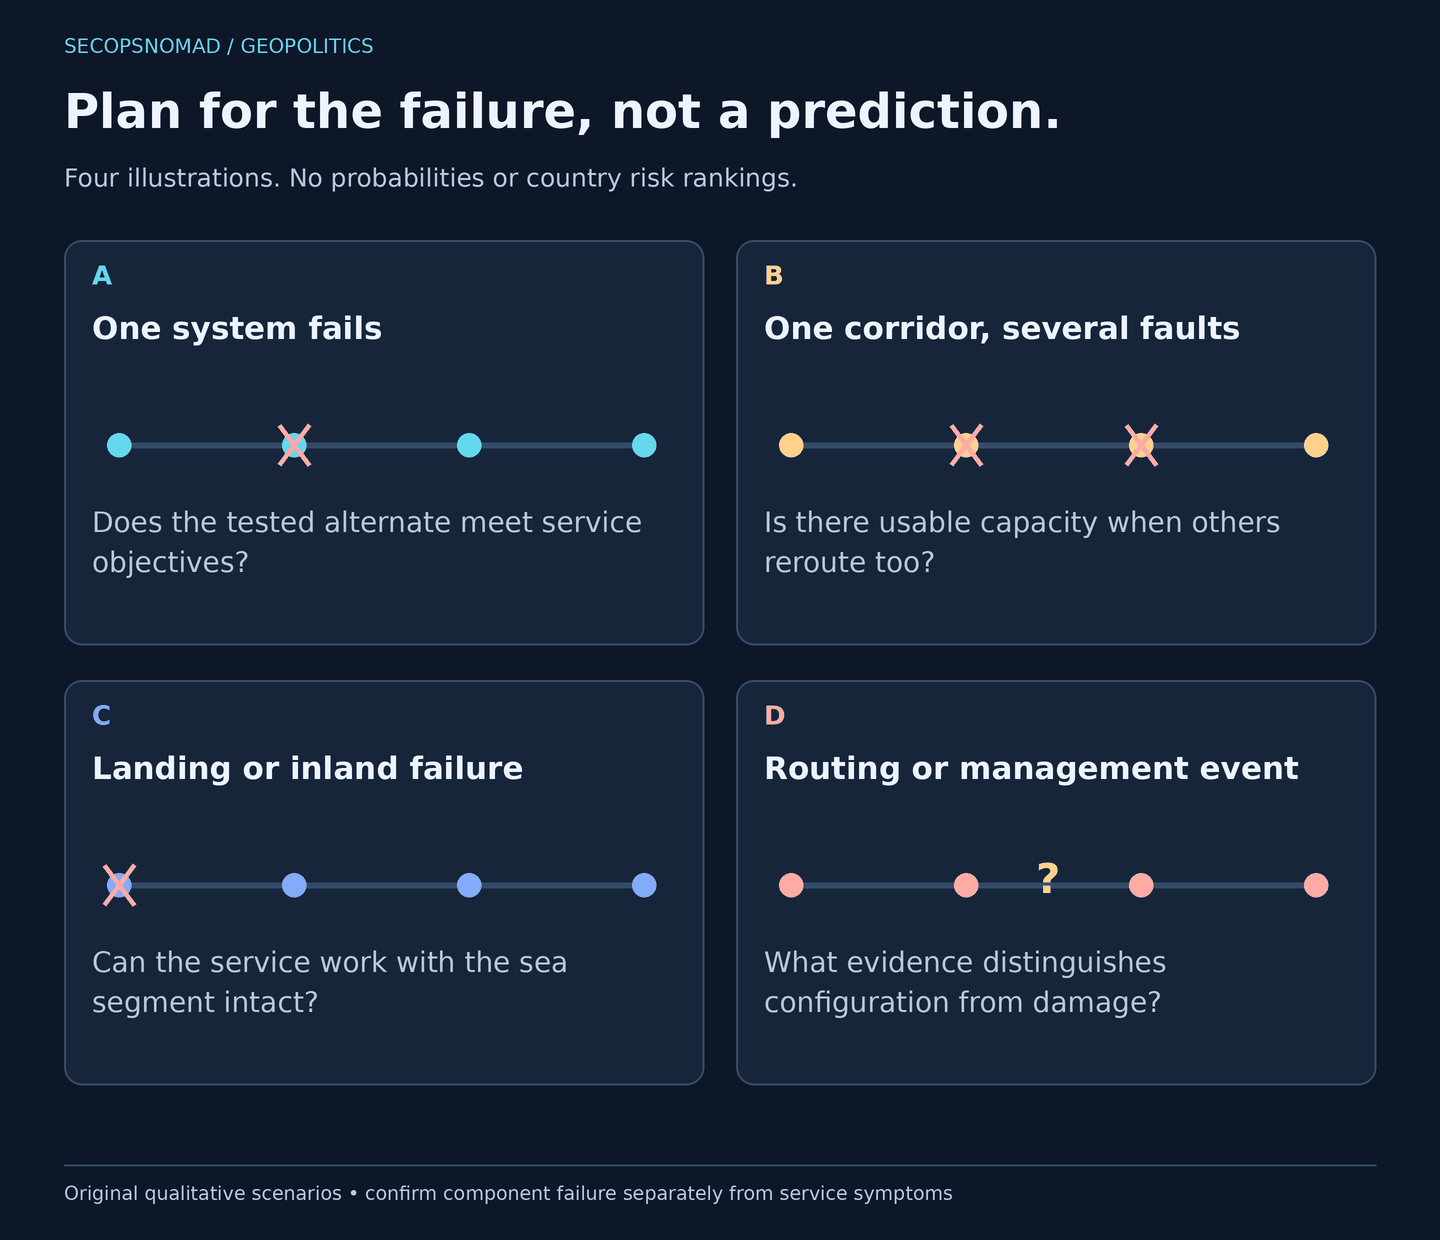
Figure 8. Scenarios test assumptions, not the probability of war or sabotage. Original planning matrix. Open full-size diagram.
- One system fails, an independent alternative works. The question is whether critical services meet their performance objectives after rerouting. A physical repair can take longer than the service interruption.
- Several systems share the affected corridor. Multiple customers may move traffic at once. The issue becomes spare capacity and prioritisation, not simply whether another line exists on the map.
- A landing or inland dependency fails. A perfectly intact ocean segment may no longer deliver the application. An exclusively submarine-focused plan can miss the component that matters.
- The symptom comes from routing or management. Preserve network and administrative evidence. Investigate a possible cyber or configuration event alongside provider notices; do not infer a seabed attack from loss of reachability.
These scenarios deliberately avoid naming the next attacker, assigning numerical odds or forecasting a shutdown. Each asks which evidence and capability would change a decision.
Policy is moving from protection to restoration
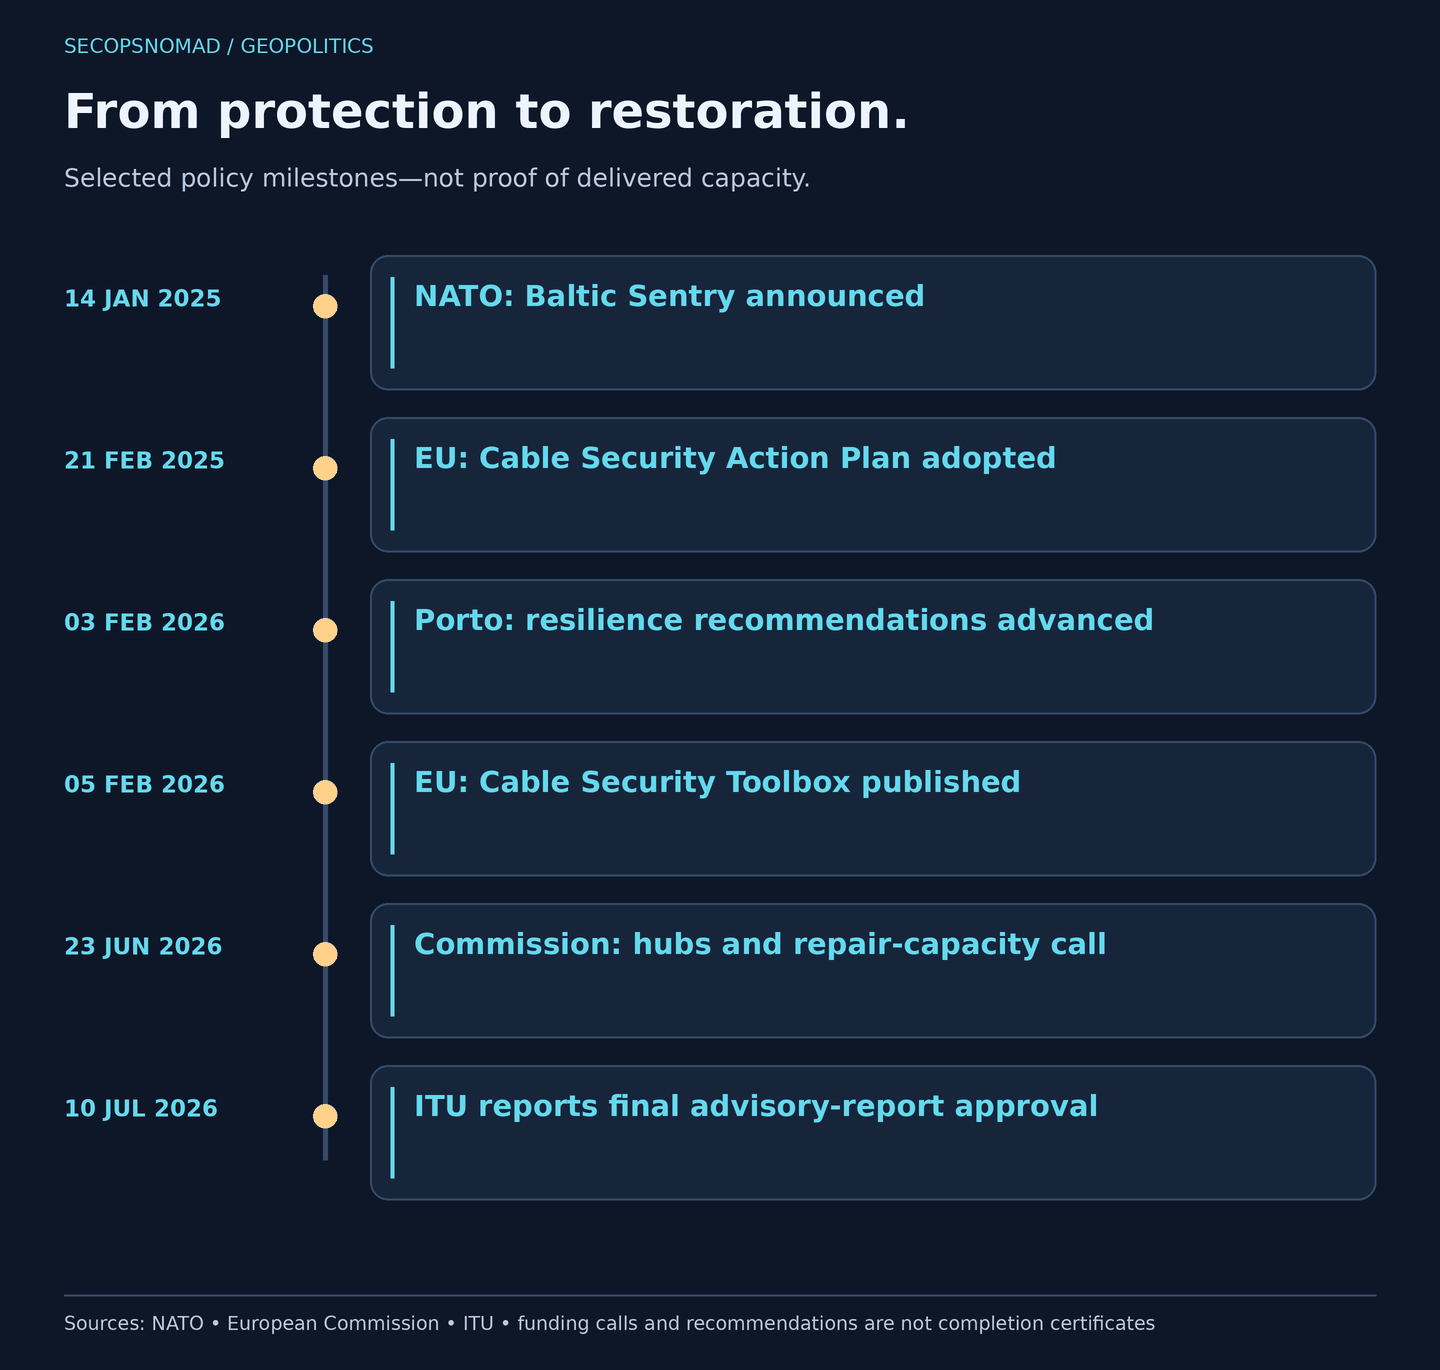
Figure 9. Selected public milestones, not a complete inventory of projects. Sources: NATO, the EU and ITU, linked in the text and source list. Announced funding and recommendations do not establish delivered capability. Open full-size diagram.
The EU's February 2026 toolbox follows its February 2025 action plan and recommends mitigations for identified risk scenarios. The 23 June 2026 announcement describes €5.8 million for two regional hubs and a €40 million call for repair capacity. A call is a funding opportunity, not evidence that additional repair vessels are already available.
ITU's 10 July 2026 announcement records approval of the advisory body's final report, highlighting concentration, repair delays and dependence on few systems. These initiatives point to the practical agenda: prevention, observation, cooperation, diversity and recovery capability.
Our assessment: the next useful measure of progress is delivery. Have permissions become more predictable? Are alternatives operational? Can repairs begin more quickly? Are maintenance and critical-service exercises funded? Expenditure, a new forum and a new cable announcement each matter, but none alone measures resilience.
The defender's response starts with dependencies
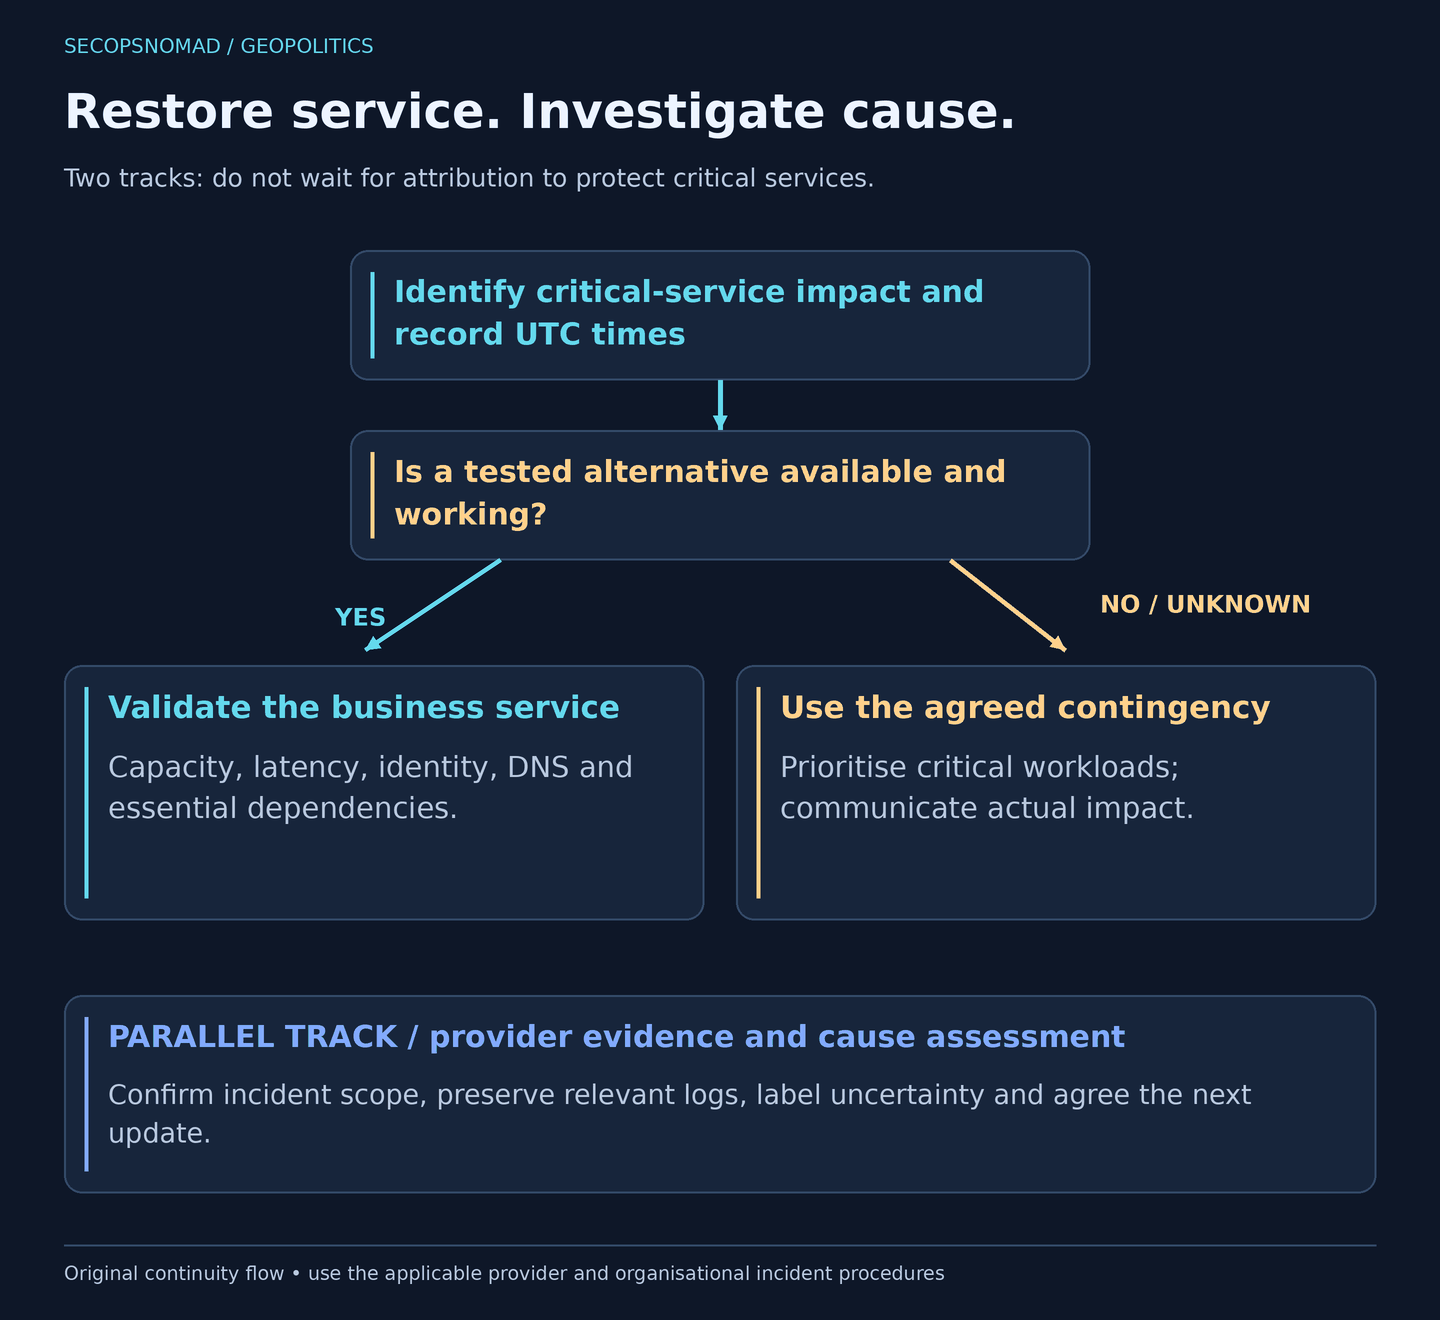
Figure 10. Restore service and investigate cause on separate tracks. Original continuity flow, not a replacement for a provider's incident procedure. Open full-size diagram.
| Owner | Before an incident | During an incident | Evidence to retain |
|---|---|---|---|
| IT Operations / network team | Map shared dependencies; exercise alternative access and application recovery | Establish scope, validate failover and protect essential services | Provider references, circuit identifiers, time-stamped performance and test results. |
| Third-party Risk / procurement | Request diversity evidence and maintenance arrangements | Obtain supplier-confirmed scope, constraints and update times | Contracted objectives, supplier statements and known exceptions. |
| Legal / Privacy | Review contractual duties and contingency data routes with the relevant specialists | Assess implications of the actual facts and jurisdictions | Applicable clauses, approved decisions and the factual basis for communications. |
| Business service owners | Define minimum viable services and acceptable degradation | Set restoration priorities and communicate service impact | Dependencies, priorities, decision owners and review times. |
A concise supplier request is more useful than an allegation:
Service/circuit: REPLACE_WITH_REFERENCE
Observed impact and UTC time: REPLACE_WITH_FACTS
Please confirm affected systems, landings/backhaul if disclosable, and incident reference.
Which alternate path is available, with what usable capacity and constraints?
Which restoration objective applies, and what dependencies remain unresolved?
Please distinguish confirmed facts from estimates and provide the next update time.
There is no universal malicious IP address or KQL query that proves a cable cut. Use authorised service monitoring, provider evidence and relevant network or administrative logs. If the investigation becomes a cyber incident, build the hunt around that evidence. Do not disguise a reachability test as attribution.
What to watch, and what is still unknown
For the next 12–24 months, useful signposts are delivered route and landing diversity, usable alternative capacity, repair mobilisation arrangements, clearer permissions and exercises that include the business application. These are monitoring questions, not forecasts of when a cable will fail.
Public sources do not establish your organisation's physical path, the condition of every cable, private maintenance priorities or the cause of an uninvestigated incident. Our repair chart uses a published summary, not raw repair records. The global map does not rank national resilience, and the scenario matrix assigns no probabilities.
The Arctic column explores how physical geography changes trade and strategic assumptions. The same discipline applies here: a possible new route should be judged by the service it can deliver, the risks it separates and the cooperation it needs to recover.
The internet's geopolitical fault lines are not only where a cable might break. They are where many parties assume somebody else owns the alternative, the permission or the repair. Real resilience makes those assumptions visible before they are tested.
Sources and publication note
Primary and specialist sources checked 15 October 2026:
- ITU, Porto Submarine Cable Resilience Summit, 3 February 2026: international-traffic share and resilience recommendations.
- ICPC, Charting Submarine Cables, 25 June 2025: broad fault and accidental-damage estimates.
- ICPC, 2026 Plenary Highlights: repair figures reported in its public presentation summary.
- World Bank, The world needs a digital lifeline: Tonga's international-connectivity disruption in 2022.
- ITU, March 2022 highlights: international versus outer-island restoration in Tonga.
- NATO, Baltic Sentry announcement, 14 January 2025.
- European Commission, Cable Security Toolbox, 5 February 2026, with a corrected report dated 16 March 2026.
- European Commission, Regional Cable Hubs and repair-capacity call, 23 June 2026.
- ITU, Approval of the advisory body's final report, 10 July 2026.
- Japan's Ministry of Foreign Affairs, Tuvalu cable-landing statement, 12 December 2024.
- TeleGeography, 2025 map overview, 20 January 2025: regional corridor context; no map artwork copied.
- Basemap: Natural Earth, public domain. Photograph attribution and licence appear under Figure 6.
Publication note, 15 October 2026: original SecOpsNomad analysis with nine explanatory body graphics, a header graphic and one credited archive photograph, in English and Japanese. We have not inspected a cable, verified a customer's route, run a provider failover or independently attributed an incident. Drawings, scenarios and operational checklists are editorial analysis; source-reported figures are identified separately.